14 Writing research reports
Main goal of a research report
One of the goals of this course is to better prepare you to report the results of your research in a conventional political science format, such as a thesis, a capstone paper, or a journal article. The main goal for this report is to report the results of your research clearly, concisely, and correctly, in a way that reflects the range of results from an honest disinterested analysis of the available data using the range of reasonable research designs.
The report should not be a non-representative report of results selected to support a particular hypothesis: the reader should not be able to analyze the data that you used (or analyze similar available data) and produce a result from a reasonable research design that is not within the range of results in your report.
Parts of a research report
Let’s run through the parts of a conventional report of political science research.
Title page
The title page should include a title, your name, date, an abstract, and three key terms related to the report. Include acknowledgements for persons who have contributed to the manuscript but do not qualify for co-authorship, but the convention is to get permission from any person you plan to list in an acknowledgment, to account for the person possibly not wanting to be associated with you or the manuscript. I don’t think this permission is needed for acknowledgements of anonymous peer reviewers. And, even though a journal editor might help you or provide good comments, at least some journal editors prefer to not be cited in the acknowledgments.
The title should be phrased as general as permissible, to have an audience as large as deserved.
Consider whether the title is better indicating the results or indicating only the research question.
The abstract should, in no more than 250 words, summarize at least the research question or the most important hypothesis, the most important elements of the research design, the most important result(s), and any important implication(s) of the result(s).
Introduction
- Indicate the research question and why the question is interesting or important. Consider starting with an anecdote or fact to illustrate the importance of the research question or starting with a puzzle that your theory can explain. Focus on most important contribution of your paper.
Literature review
Discuss past research to indicate how your study will fit into the existing literature. For example, if no one has investigated your research question before, then establish that. If your research question has been investigated before, but you are doing something different or better, then establish that. If your research question has been investigated before and the results have been mixed, then establish that. In other words, tell the reader why your study is useful. Include citations that substantiate your claims about your study’s place in the literature. This isn’t necessarily a history of past research related to your research question, but the literature review should discuss important research that is related to your research question, such as past research using your outcome or closely related outcomes and past research using your main predictor or closely related predictors.
Consider providing a substantive title for the literature review that describes the content of the literature review. So, instead of “Literature review”, consider something such as “Prior research about the relationship between X and Y”.
Think about the depth of description that you should provide for each citation. In some cases, all that is needed for a citation is the topic of the study, to, for example, establish that the topic has been studies. In other cases, a mere indication of the finding might be all that is needed. But, in other cases, detailed description about the research design for a cited study might be needed, such as to convince the reader that the cited finding is based on a valid research design and representative sample.
Think about whether the name of the cited study should be in the main text of the sentence (for an emphasis on the study) on in the citation only (for an emphasis on the finding from the study).
If you aren’t sure how much detail to provide, at least initially providing a lot of detail about a study, because it’s easier to remove details from your summaries than to add details later.
Important details to consider mentioning in your summaries include study samples (such as U.S. residents, compared to, say, German residents), study representativeness (such as a relatively representative sample like the American National Election Studies, compared to, say, an online convenience sample), methods of causal inference (such as statistical control, compared to, say, random experiments, or, for that matter, statistical control with a lot of good controls, compared to, say, statistical control with only a few good controls), year of the study (with studies that used older data being less useful, all else equal), and measurements (such as measuring behavior directly, compared to, say, self-reported behaviors). It can also be a good idea to, if possible, indicate the size of the key estimate(s), to indicate whether the estimate suggests a weak, moderate, or strong association or effect.
If multiple consecutive sentences refer to the same study, don’t cite the same study multiple times, but instead rephrase so that only one citation is needed.
Don’t combine citations for different things. For example, if citation A refers to the first part of a sentence and citation B refers to the second part of the sentence, don’t write:
{First part of the sentence, second part of the sentence} (citations A and B).
Instead, write:
{First part of the sentence}(citation A), {second part of the sentence} (citation B).
Theory
For your hypothesis (which can be a null hypothesis or an alternative hypothesis), provide an explanation for the expectation in the hypothesis. But do not use causal language to describe the hypothesis if the data cannot establish causality: phrase the hypothesis as a true-or-false claim that can be tested with the data.
Example to avoid: Regularly attending religious services makes people more likely to vote.
Example that is better: Persons who regularly attend religious services will on average be more likely to vote than persons who do not regularly attend religious services, net of controls.
Write the theory section so that even a null result would be interesting. If the analysis does not provide sufficient evidence to reject the null hypothesis, then don’t worry, as long as the results still provide useful information about the plausible range of the effect.
The logic of the theory section should lead directly to the hypothesis. This hypothesis can be presented first or presented again at the end of the theory section. The hypothesis should be clearly stated but does not need to be formally listed as H1.
Research design
Describe the method that you used to test the hypothesis, in sufficient detail so that a reader can properly assess and replicate the results. The Research Design section should indicate the major elements of the research design, such as sample size, measurement of key variables such as the outcome variables and main explanatory variables, estimation technique, the time period for the data, and handling of any missing data. For a survey, provide an indication of the sampling process and whether population weights will be applied and, if so, the population (e.g., U.S adult residents).
If you use someone else’s dataset, provide a citation. It’s also good practice to cite statistical packages that you use, to give credit and also because that presumably makes your work seem more credible.
The Supplemental Information / Appendix should contain any information that is needed to reproduce your results but is not necessary to understand the research. For example, if household income is a control variable in your analysis, it is not necessary for the main text to indicate the coding of each category of household income, such as 21 being the code for annual household incomes between $180,000 and $199,999; that information can instead be placed into the Supplemental Information, with the main text at most describing the ends of the coding of the control (e.g., “annual household income is coded from 1 through 22, from less than $5,000 to $200,000 or more”).
For missing data, consider whether the missing data can be placed into a substantive category or should be in a separate category. For example, if your theory is about approval of the president, that might be coded as 1 for “indicated approval”, 0 for “did not indicate approval when given the opportunity”, so that refusals and don’t knows can be coded as 0. But if a measure of income has a refusals, there isn’t a similar substantive category of income to place that in. Income could be coded as 1 for reporting an income above the median and 0 for not reporting an income above the median. But it might be better to code income such as $0 to $29k, $30k to $49k, $50k to $69k, etc…, with refusals/don’t knows as a separate category, and then analyze the data so that income is analyzed categorically. If missing data are in a separate category in a predictor, then this can be easily handled with a “i.” factor notation in Stata, which will treat each level of the predictor as a separate category.
But if missing data are in a separate category in the outcome variable, then this can influence your choice of estimation technique. If the outcome has more than two categories and one of these categories is a category for missing/refusals/don’t knows, then the proper estimation technique is multinomial logit or an equivalent technique that does not treat the outcome as ordered. Another option is to omit from the analysis observations that are missing outcome values, but this might be justifiable only if a small percentage of observations are missing outcome values and if the missing outcome values are plausibly missing at random.
Make sure to treat missing values based on the reason for the missingness. If a value is missing from survey data because the respondent never received that item, then that missing data should be treated differently than values missing because the respondent received the item and decided to not provide a response.
For an OLS regression, consider how to code the variables so that the results are easily interpretable. Placing all variables on a 0-to-1 scale can make it easier for a reader to understand the results, because the reader does not need to remember the scale for each variable. However, some variables have “real” units, such as dollars of GDP, so these variables might be more understandable on a real scale, although these variables might be better coded in terms of, say, millions of dollars instead of individual dollars, so that the coefficients are not very small or very large.
But even for these variables in real units, a 0-to-1 coding (in which 0 is the lowest observed value and 1 is the highest observed value) isn’t a bad idea: in a linear regression using this coding for a predictor, the coefficient indicates the predicted change in the outcome variable, from the lowest observed level to the highest observed level of the predictor.
Potential codings for a predictor include:
- a set of categories
- linear, from 0 to 1
- linear, with a mean of 0 and a standard deviation of 1
- linear, with a mean of 0 and a standard deviation of 0.5, to increase the possibility that the continuous predictors have a standard deviation similar to the dichotomous predictors
- linear, in real units, such as years of education or thousands of dollars
- non-linear, to reduce the extremeness of an outlier or to account for non-linear associations
Consider which category to omit for a categorical predictor. Good choices include the category of interest, the category with the lowest level of the outcome net of controls, or the category with the highest level of the outcome net of controls.
Consider how to categorize predictors for optimal comparison. For example, if your main interest is estimating the effect of poverty, it might not be ideal to code and then compare a poor category to a non-poor category; instead, it might be better to code categories such as in poverty, near poverty, middle class, and wealthy, with the key comparison between poverty and near poverty, to better assess the effect of poverty.
The text should describe variables so that the reader can understand what the variables measure (such as “household income”), but the text does not need to indicate variable names used in the statistical analysis (such as “hhincome”).
Results
Describe numerically or visually the distribution of the outcome variable(s) and the distribution of the main predictor(s). This might be appropriate in the research design section, to help justify the use of an estimation technique.
Do not describe correlational results using causal language. Limit assertions of causal inference to research designs that permit strong causal inference.
Interpret results only for the key predictor. The other predictors are not of interest for the hypothesis, and often estimates for a predictor used as a control cannot be plausibly interpreted as a causal estimate.
For example, suppose that we want to estimate the influence of political partisanship (X) on vote choice (Y). We would reasonably control gender (C), because gender plausibly influences X and Y. However, if we wanted to estimate the influence of gender on vote choice, we would probably not control for political partisanship, because political partisanship does not plausibly influence gender.
For cross-sectional data that indicate an association, don’t describe the association as being within-case, because cross-sectional data do not include within-case changes over time. So not this:
Net of controls, as a participant’s level of education rises, the participant is more likely to vote.
Instead, something like this:
Net of controls, participants with higher education levels are more likely to vote, compared to participants with lower education levels.
Do not interpret mere differences in point estimates as evidence about the hypothesis. Discussions about the hypothesis test should incorporate discussions of inferential statistics such as p-values and confidence intervals.
If you have a mismatch between your hypothesis and your measurement, consider rephrasing your hypothesis. For example, if your hypothesis is about individuals but your data are at the county level, consider whether the county-level data could provide a reasonably good test of your hypothesis. But not all mismatches require rephrasing your hypothesis. For example, if your hypothesis is about respondents’ political interest, and all you have available are measures of how often respondents watch CNN, FOX, or MSNBC, then that mismatch might not be large enough to justify changing your hypothesis to be about respondents’ watching political news on television.
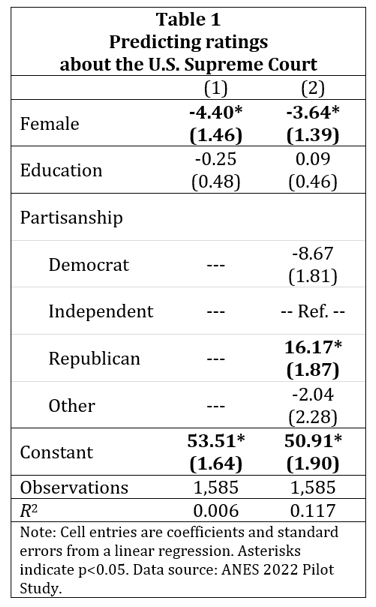
In the main text, describe the results of the hypothesis test, such as in a table and/or in a visual created in the R tidyverse package. Indicate the size of the estimated effect and the uncertainty in the estimate. Tables should report coefficients, standard errors in parentheses below the coefficient, and on the coefficients an indication of statistical significance at p<0.05 in bold text or using a single asterisk. Report results using two or three significant digits. Recode variables so that scientific notation is not needed. Avoid estimates reported with no significant digits (such as 0.00) if the estimate is substantially large and especially if the p-value associated with the estimate is less than p=0.05.
Each table note and each figure note should include sufficient information for a reader to interpret the table or figure without reference to the main text. Include at least the following for each table or figure, if applicable: a title for the table or figure, a number for the table or figure, the estimation technique for the analysis in the table or figure, the outcome variable, the scale of the outcome variable, the scale of the key predictor, an indication of what any symbols mean, and the number of observations. For tables that report results for three or more categorical predictors, include the omitted category in the table, with “Ref” (or something similar) for the result. For a table column that did not include a predictor in the model, indicate that with a “—” (or something similar).
Report evidence about the robustness of key inferences for at least one reasonable alternate specification, such as a different way to measure the outcome variable, a different way to measure the explanatory variable, a different combination of control variables, a different measure of control variables, and a different estimation technique.
Robustness checks are more useful when the reasonable alternate research design is different enough to raise reasonable questions about whether the key inference would remain. Sample robustness checks that aren’t very useful:
- Slight changes in the measurement of a predictor, outcome, or control.
- Even substantial changes in the measurement of a control variable, if the key inference has a very low p-value (say, p<0.001).
- Changes in estimation technique when the key inference has a very low p-value (say, p<0.001).
“Robustness check” does not apply to an alternate research design that tests a different hypothesis. For example, if your hypothesis is about attitudes among women, then applying the research design to attitudes about men would not be a robustness check, because the results for attitudes about men don’t help us assess the correctness of the hypothesis about women.
Place into the Supplemental Information / Appendix unimportant information that is necessary to understand your results, such as tables of results for robustness checks.
For visualizations, focus the reader on what you want the reader to see.
For visualizations, consider the proper range of axes, such as whether the Y-axis should cover the potential range of results or merely cover the observed range of results.
For visualizations, explain what the error bars indicate. Use 95% confidence intervals for comparison of an estimate to a point. Use 83.4% confidence intervals for comparison of estimates to each other. A lot of researchers don’t know that 83.4% confidence intervals are better than 95% confidence intervals for assessing a p=0.05 difference between estimates, so, if the report uses 83.4% confidence intervals, consider including an explanation of the benefits of 83.4% confidence intervals (and a citation to an explanation).
Limitations
Indicate the limitations of the study, and, if possible and if needed, speculate on how addressing these limitations might influence key inferences.
Do not copy and paste output from a computer program without editing the output to look like tables that typically appear in a published article. Instead, place editable tables in a Microsoft Word file that look like this:
For Stata, a shortcut to making a table is the esttab command:
esttab using regression_output.rtf, b(%99.2f) se(%99.2f) starlevels(* 0.05) r2 ar2 pr2 nogaps label onecell replace
Discussion
Summarize the key finding(s) and discuss the implications of the key finding(s).
A good rule of thumb is that the hierarchy of implications, from most important to least important, is:
- implications for real world policy
- implications for real world understanding
- implications for social science
Declarations
Published political science nowadays often requires or at least includes declarations, such as:
- “Research with human subjects”: an indication of research ethics, such as whether IRB approval was obtained or needed.
- “Declaration of competing interests”: an indication whether any author has a financial or other interest that the reader should know about
- “Funding”: an indication of who or which organization(s) paid for the data collection, data analysis, publishing fees, or other aspects of the research
- “Data availability statement”. an indication of whether you will post replication materials so that others can check your work and, if so, where
Miscellany
For social science papers that you write, find a recent publication in a journal that you aspire to or at least could publish in, and follow the formatting for that publication. Journal submission webpages also often provide indications about style and formatting, so it can be useful to follow that formatting, so that you can signal that you know how to format a manuscript in your discipline. Political Analysis has a nice set of directions: https://www.cambridge.org/core/journals/political-analysis/information/author-instructions/preparing-your-materials.
Do not selectively report results that favor or disfavor a hypothesis. If you generated or modified the hypothesis after you analyzed the data, do not indicate or imply that the hypothesis was generated before testing the hypothesis.
Use a disinterested approach that does not suggest that you are invested in the results. For example, avoid “In this report, I argue that…”, and instead revise such as “In this report, I test the hypothesis that…”.
Limit the claims in the paper to the claims that the paper needs to make (i.e., remove unnecessary “veto point” claims that a reader or a peer reviewer can use to reject your analysis).
Think about the most important result or results from your study, and revise the paper to make that result or results clearer to the reader.
Even if the statistical analysis does not permit causal inference, the paper describing the analysis can still use causal language to discuss the theory about the hypothesis. For example, suppose that our hypothesis is that regularly reading a newspaper increases political knowledge. Even if the research design is a non-experimental correlational analysis that does not permit strong causal inference, the paper can discuss the theory in causal language, and then discuss the results in correlational language. The discussion of results can discuss whether the correlational results are consistent with the theory/hypothesis and then discuss concerns about causal inference.
Consider whether the analysis would benefit from a test of discriminant validity. For example, if your key predictor is attitudes about Black Lives Matter, a good analysis would assess the extent to which the estimated influence of attitudes about Black Lives Matter differs from the estimated influence of attitudes about Black people, so that the analysis provides an estimate of the distinctive influence of attitudes about Black Lives Matter. Similar tests of discriminant validity could be conducted for outcomes, such as to assess the extent to which education’s estimated effect on attitudes about Black Lives Matter differs from education’s estimated effect on attitudes about Black people.
Consider how granular your results should be reported. For example, if your key predictor in a linear regression is attitudes about Black Lives Matter, consider whether it is better to report a single estimate of the influence of attitudes about Black Lives Matter across the range of attitudes about Black Lives Matter or to report multiple estimates, such as the influence of negative attitudes about Black Lives Matter and the influence of positive attitudes about Black Lives Matter.
Consider whether the analyses would benefit from subsample analyses and, if so, which subsample analyses are most useful and/or interesting and/or important.
The conventional order of the sections for a political science publication is not necessarily the optimal order to write the sections. For example, it is not unreasonable to draft the introduction in light of your research results. By the way, if the recency of a study is important, then mention the years of data collection if these are available, so that the reader can have more confidence in the recency of the study. For example, this article published in 2019 (https://doi.org/10.1017/S1742058X19000195) used data collected fourteen years earlier, in 2005 (https://www.tessexperiments.org/study/brueckner275), so that the 2019 publication date can be misleading.