9 Repeated observations
9.1 The logic of panel data
In cross-sectional data, cases are observed once at one point in time, such as if we surveyed 1,000 participants this past Tuesday or if we observed the crime rate in each state in 2022. But for panel data, we have multiple data points for each case, such as a survey of 1,000 participants this past Tuesday and another survey six months from now, or a measure of the crime rate in each state in 2020, in 2021, and in 2022.
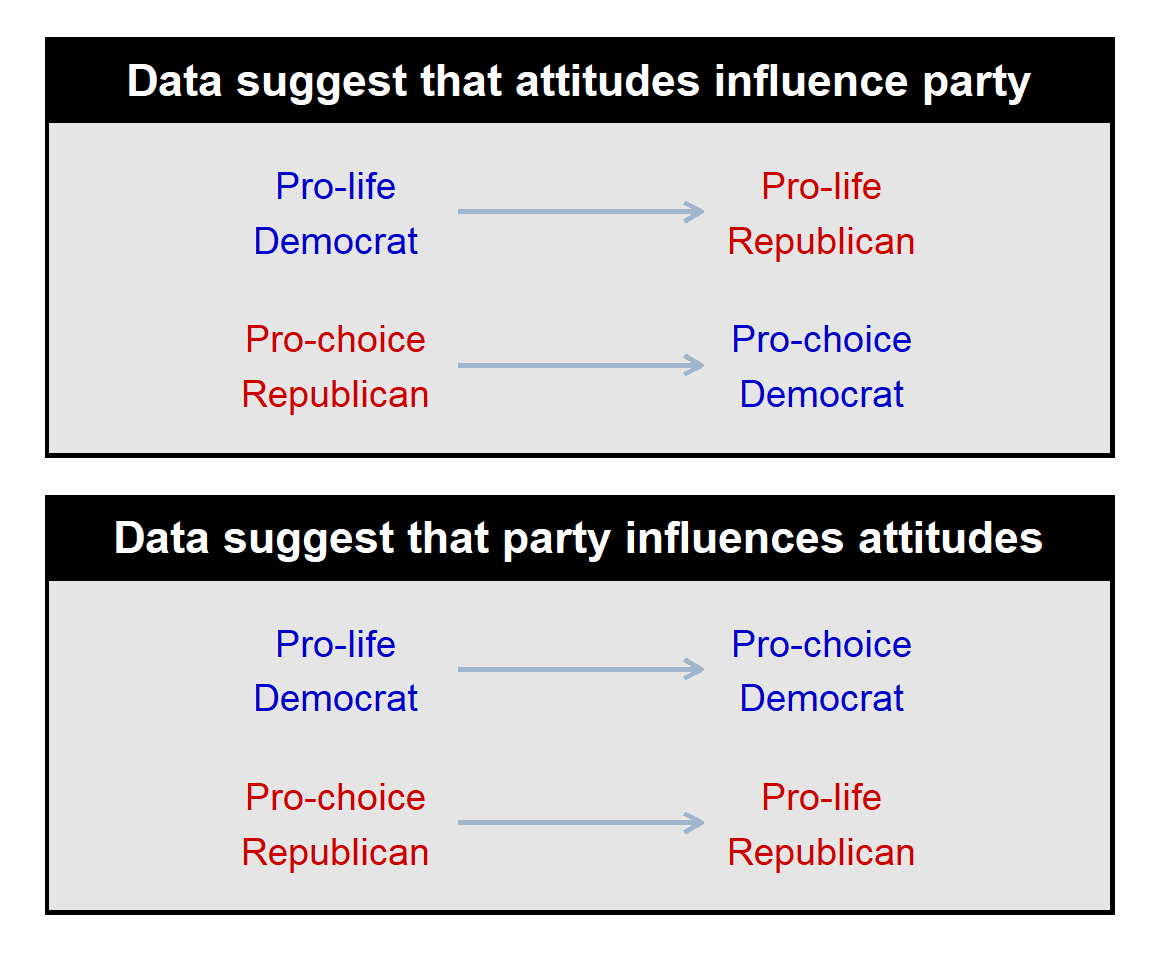
Compared to cross-sectional data, panel data can be more useful for causal identification, because we can observe changes over time within a case. For example, suppose that, compared to a year ago, U.S. residents are now better sorted by partisanship and abortion attitudes, such as if, compared to a year ago, a higher percentage of Republicans are pro-life and a higher percentage of Democrats are pro-choice. Based merely on this pattern, we could not tell whether this is due to a change in party, a change in abortion attitudes, or both. But suppose that panel data indicated that the only relevant changes were pro-life Democrats changing to be pro-life Republicans and pro-choice Republicans changing to be pro-choice Democrats; in that case, we can plausibly infer that abortion attitudes caused these changes in partisanship. But suppose that the panel data instead indicated that the only relevant changes were pro-life Democrats changing to be pro-choice Democrats and pro-choice Republicans changing to be pro-life Republicans; in that case, we can plausibly infer that partisanship caused abortion attitudes to change.
Sample practice items
Suppose that, for four participants, a researcher has data from a survey in January and another survey in December of the same year, with each participant appearing twice in the dataset. For each participant and for both months, the dataset has an indication of the participant’s political party (D or R) and an indication of whether the participant supports or opposes abortion. Data are below, with each participant identified with an ID:
| ID | January | December |
|---|---|---|
| 1 | D + Support | D + Support |
| 2 | D + Oppose | R + Oppose |
| 3 | R + Support | D + Support |
| 4 | R + Oppose | R + Oppose |
Based on these data only, which of the following inference is more supported?
- political party influenced attitudes about abortion
- attitudes about abortion influenced political party
Answer
IDs 1 and 4 don’t change, so we can ignore those observations. ID 2 changes party but keeps their attitude, and ID 3 also changes party but but keeps their attitude, so that seems more consistent with attitudes influencing party (B).9.2 Panel analysis
Panel data have multiple observations from a case over time, such as survey participants completing a survey each year for three years or observations of a set of countries each year over a decade. These observations are not independent, and the analysis should account for this.
For an illustration, the plot below has 12 points and a line of best fit through the points. The predictor is X and the outcome is Y.
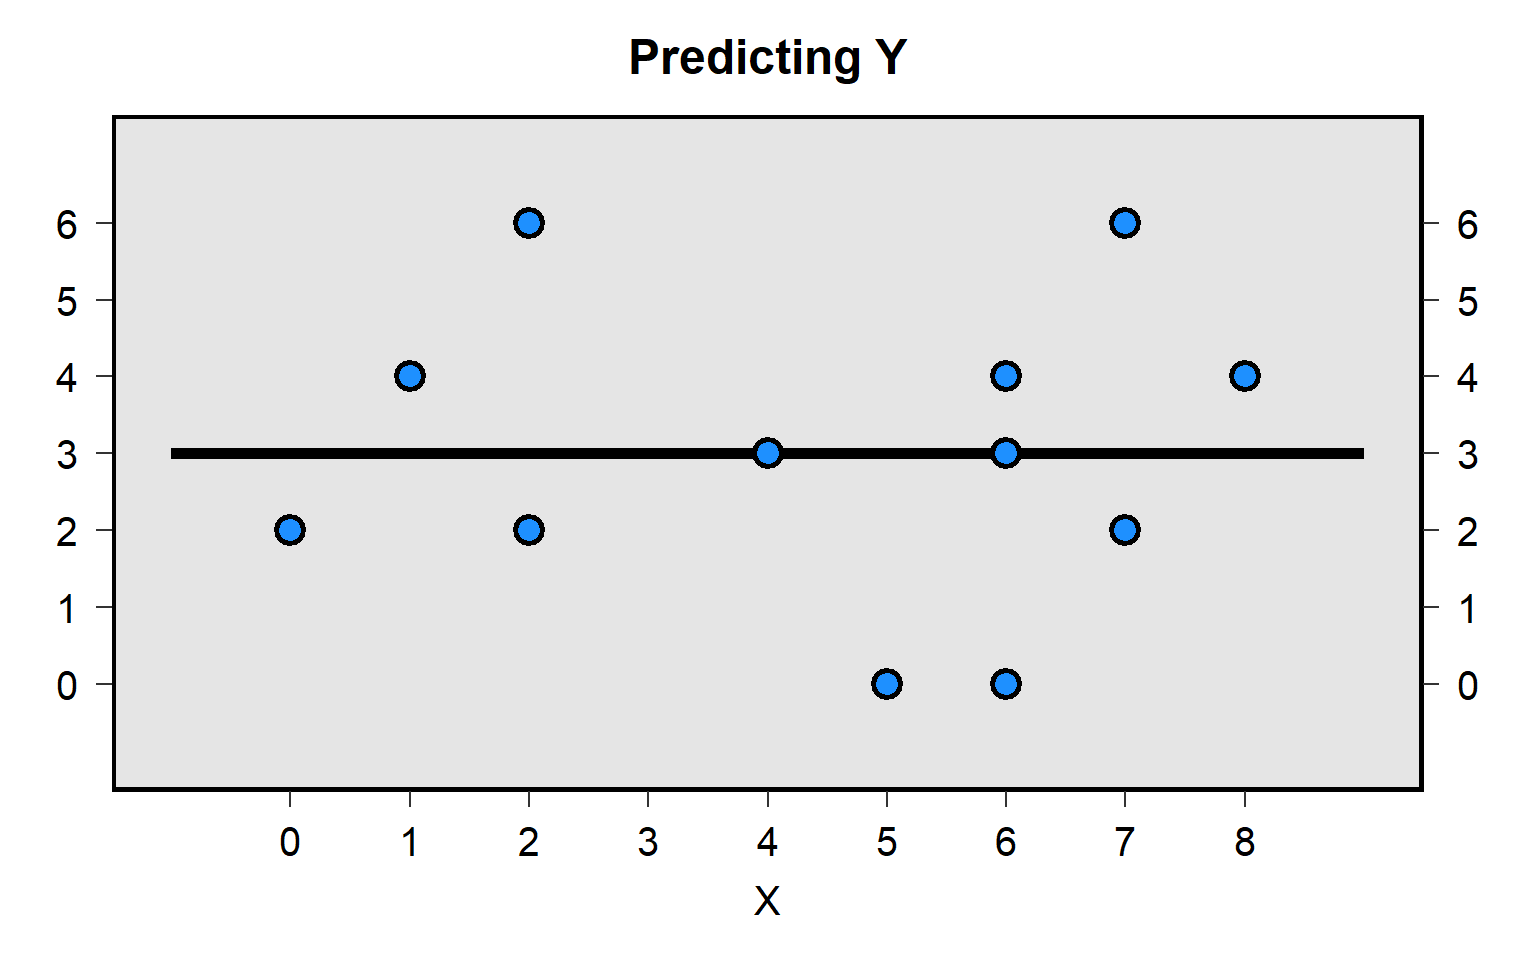
The slope of the line is flat.
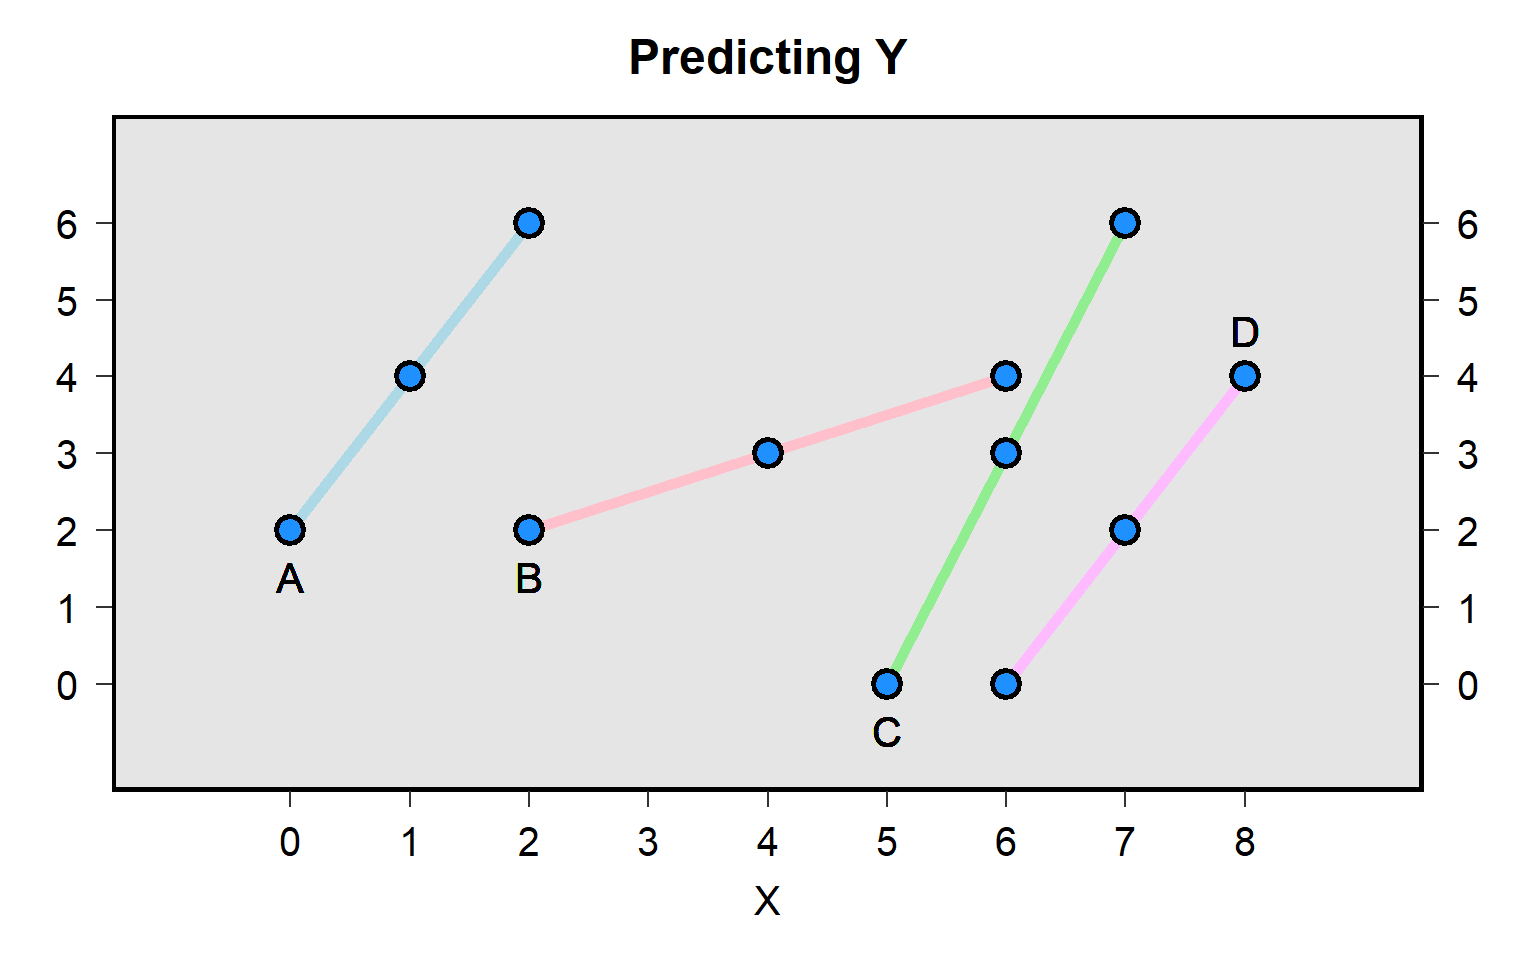
But suppose that the 12 points were not independent of each other but were rather drawn only from four countries – A, B, C, and D – with each country having a point from the year 2010, another point from the year 2011, and another point from the year 2012. The plot below indicates that, even though the overall association between X and Y is zero across all 12 points, the patterns within country indicate that higher X associates with higher Y:
For panel analysis, a fixed-effects regression uses information from the predictors that vary within country but does not use information from predictors that vary between countries. However, a random-effects regression uses information from the predictors that vary within country and from predictors that vary between countries.
For a random-effects regression predictor in which the value of the predictor changes within country and between countries, the coefficient indicates the predicted change in the outcome variable when the predictor increases one unit within and between countries, holding other model predictors constant. For a random effects regression predictor in which the value of the predictor does not change within country, the coefficient indicates the predicted change in the outcome variable when the predictor increases one unit between countries, holding other model predictors constant.
Sample practice items
Suppose that we had data for each country for each of ten years. Which of the following panel methods would incorporate information about variation within countries across years, but would not incorporate information about variation between countries?
- fixed effects
- random effects
Answer
- fixed effects