6 Randomized experiments
Major learning objective(s) for this section:
- Explain what random assignment error is.
- Know the benefit of randomly assigning participants to groups in a randomized experiment.
- Explain how a randomized experiment can permit valid causal inferences.
6.1 Alternate explanations
Data from the ANES 2020 Social Media Study indicated that, compared to respondents who do not use Instagram, respondents who use Instagram were more likely to have voted for Joe Biden than to have voted for Donald Trump in the 2020 U.S. presidential election. The p-value was less than p=0.05 for a test of the null hypothesis that the percentage of Instagram users who voted for Joe Biden equaled the percentage of Instagram non-users who voted for Joe Biden, so we can infer at the conventional level in political science that these percentages differ from each other.
However, we can’t use this information to credibly infer that using Instagram caused respondents to be more likely to vote for Joe Biden, because there are plausible alternate explanations that are still available. For example, as indicated in the table below, compared to respondents who do not use Instagram, respondents who use Instagram were more likely to be female, were more likely to be non-White, and were younger. Therefore, the “Uses Instagram” group differs from the “Doesn’t use Instagram” group on many characteristics, so we can’t isolate Instagram as a reason why Instagram users were more likely to vote for Joe Biden than Instagram non-users were.
| Mean / Percent | Uses Instagram | Doesn’t use Instagram | p-value |
|---|---|---|---|
| % vote Biden | 67% | 54% | p<0.0001 |
| % female | 59% | 44% | p<0.0001 |
| % non-White | 42% | 24% | p<0.0001 |
| Mean age | 41 | 56 | p<0.0001 |
6.2 Randomized experiments
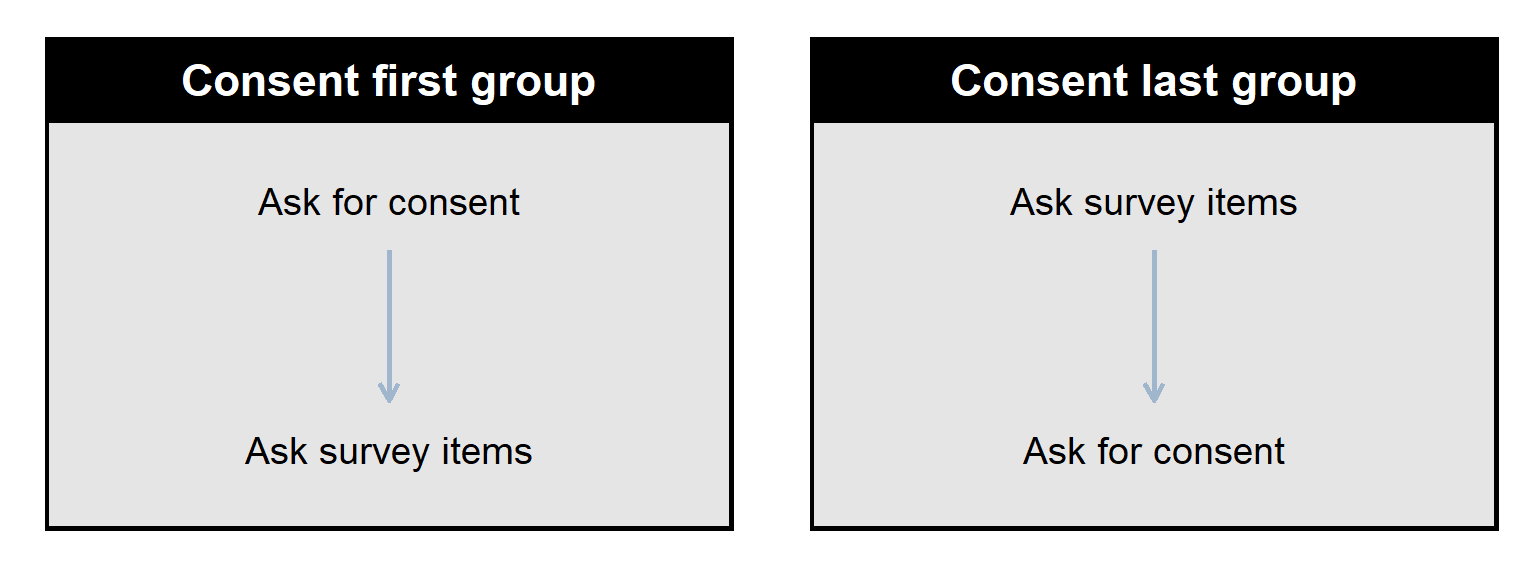
Now let’s discuss a randomized experiment that was conducted on the the ANES 2020 Social Media Study that does permit us to infer causality at the conventional level in political science. For this experiment, participants who reported having a Facebook account were asked to agree to permit the ANES researchers to access the participant’s information on Facebook. However, some participants were randomly assigned to be asked for this permission near the start of the survey (which we will call the “Consent First” group of participants), and other participants were randomly assigned to be asked for this permission near the end of the survey (which we will call the “Consent Last” group of participants).
This randomization of participants to groups is intended to produce two groups that are as equal to each other as possible. The randomization isn’t perfect: sometimes random assignment to groups will produce one group that has a much higher percentage female than another group has, or a much higher mean age than another group has, or a much higher mean education level than another group has. Any such differences between groups due to imperfections in the random assignment is called random assignment error. This random assignment error isn’t “error” in the sense of a mistake. Instead, this random assignment error is error only in the sense of imperfection.
Randomized experiments are great for causal inference, because, in a randomized experiment, there are only two possible explanations for a difference between groups: [1] random assignment error caused the difference between groups, or [2] the difference in treatment caused the difference between groups. Even better, for a test that the groups equal each other on a characteristic, a p-value of p<0.05 permits us to reject random assignment error as a likely explanation, which leaves only the difference in the treatment as a likely explanation.
Below is a summary table for the Facebook experiment, comparing the “Consent First” group to the “Consent Last” group: the groups were very similar to each other in percentage female, percentage White, mean age, and mean education, but the groups were not similar to each other in the percentage of respondents that consented to have the ANES researchers access the participant’s information on Facebook.
| Mean / Percent | Consent First | Consent Last | p-value |
|---|---|---|---|
| % consented | 65% | 44% | p<0.0001 |
| % female | 49.2% | 49.8% | p=0.64 |
| % White | 68.9% | 69.7% | p=0.53 |
| Mean age | 50.53 | 50.46 | p=0.88 |
So, for this experiment, the p-value under p=0.05 means that we can conclude at the conventional level in political science that, compared to asking for consent near the start of the survey, asking for consent near the end of the survey caused a lower percentage of participants to consent to permit the ANES researchers to access the participant’s Facebook information.
6.3 Effects of random assignment error
Random assignment error can bias inferences in any direction. Let’s imagine a sample that has two Democrats and two Republicans. Let’s color Democrats as blue and Republicans as dark red. Democrats tend to be politically liberal, and Republicans tend to be politically conservative. In an experiment, a treatment group receives a treatment, and a control group receives no treatment (or the treatment is assumed to have no effect on the outcome that we are interested in).
If the random assignment of these four participants to a control group and a treatment group does not have random assignment error by political party, then the groups will be like in the plot below, equal by party before the difference in treatment:

But random assignment error could produce a control group that has both of the Democrats and a treatment group that has both of the Republicans (like in the plot below), so that – even before the treatment is applied – random assignment error has biased the experiment toward the conclusion that the treatment increases conservative outcomes.

And random assignment error could produce a control group that has both of the Republicans and a treatment group that has both of the Democrats (like in the plot below), so that – even before the treatment is applied – random assignment error has biased the experiment toward the conclusion that the treatment increases liberal outcomes.

So random assignment error can bias the estimate of a treatment effect in any direction.
Random assignment error can also mask effects. Suppose, for example, that a treatment makes people more conservative, but random assignment error caused the treatment group to have a higher percentage of Democrats than the control group has: the treatment pushed outcomes in the conservative direction, but the random assignment error biased outcomes in the liberal direction, so that these two effects can offset each other.
6.4 More on randomized experiments
The key type of randomization in a randomized experiment is randomization of participants to condition. Merely randomly selecting a group of participants for a study does not make that study a randomized experiment.
Random sampling from a population helps get a sample to be close to the population in all possible characteristics, especially for larger samples. So if we randomly sample a large number of ISU students, the percentage female in the sample should be close to the percentage female in the ISU student population of about 57%.
Random assignment within an experiment is intended to get the groups in the experiment to be similar to each other before the groups are treated differently; but the random assignment doesn’t help get the sample of participants to better represent the intended population. So, for instance, if we have a sample of ISU students that is 80% female, randomly assigning this sample to groups in an experiment will help get each group to be about 80% female, but the random assignment won’t help address the fact that the 80% female sample of ISU students does not closely match the 57% female population of ISU students.
By the way, sometimes for randomized experiments testing for bias (such as gender bias, using a male target and a female target), some students suggest that each participant should be given each target to rate. But asking participants to, for example, rate a male target and then rate an equivalent female target will make it easy for participants to conceal any gender bias that they have, If we instead asking each participant to rate only the male target or to rate only the female target, we can’t use the experiment to identify any particular participant as having a gender bias, but we will have a more plausible estimate of the on-average gender bias among the set of participants.
Sample practice items
Which one of these is NOT a necessary step in a randomized experiment involving human participants?
- Randomly assign participants to groups.
- Measure some outcome for each group.
- Treat each group differently.
- Use control variables to eliminate alternate explanations.
Answer
- Use control variables to eliminate alternate explanations.
Randomly assigning participants to groups helps a randomized experiment identify causes by…
- eliminating demand effects as much as possible
- getting the groups to be as similar to each other as possible before the difference in treatment
- getting the sample to be as representative of the population as possible without weighting
- helping as much as possible avoid regression toward the mean
Answer
- getting the groups to be as similar to each other as possible before the difference in treatment
A researcher randomly selects 200 people from a population and then randomly assigns 100 of these people to a group that receives Treatment A and randomly assigns the other 100 people to a group that receives Treatment B. The random selection from the population…
- better permits the researcher to make an inference about the population
- better permits the researcher to make an inference about whether Treatment A has a different effect than Treatment B has among participants in the sample
Answer
- better permits the researcher to make an inference about the population
Suppose that a researcher wants to test whether a pill causes weight loss, so she assigns a randomly selected set of 1,000 U.S. residents to take the pill each morning for ten weeks. Results indicated that the mean weight of the participants decreased over the ten weeks of the study (p<0.001). Based on this evidence, can we conclude at the conventional level in political science that the pill caused the weight loss among these participants, at least on average?
- Yes
- No
Answer
- No
The random selection from the population is not the type of randomization needed for the randomized experiment to work. It’s possible that the reason why participants lost weight was that the experiment was conducted during the spring or summer, when people were more active. This study did not have a control group to compare the participants to, so we can’t be sure what caused the weight loss.
A researcher randomly selects 200 people from a population and then randomly assigns 100 of these people to a group that receives Treatment A and randomly assigns the other 100 people to a group that receives Treatment B. The random assignment to groups…
- better permits the researcher to make an inference about the population
- better permits the researcher to make an inference about whether Treatment A has a different effect than Treatment B has among participants in the sample
Answer
- better permits the researcher to make an inference about whether Treatment A has a different effect than Treatment B has among participants in the sample
Suppose that, in a randomized experiment, the mean response from participants in the control group differs from the mean response from participants in the treatment group. One reason for this is that participants in the control group were treated differently than participants in the treatment group. The other possible reason why the mean response from participants in the control group differed from the mean response from participants in the treatment group is…
- a ceiling effect
- random assignment error
- regression toward the mean
- Simpson’s paradox
Answer
- random assignment error
Suppose that a researcher conducted a randomized experiment and then compared the mean response from participants in the control to the mean response from participants in the treatment. The p-value was p=0.01 for a test of the null hypothesis that these means equal each other. Based on this p-value, the researcher should conclude that…
- the treatment had an effect
- the treatment did not have an effect
- there is not enough evidence to conclude that the treatment had an effect
Answer
- the treatment had an effect
Suppose that a researcher conducted a randomized experiment and then compared the mean response from participants in the control to the mean response from participants in the treatment. The p-value was p=0.49 for a test of the null hypothesis that these means equal each other. Based on this p-value, the researcher should conclude that…
- the treatment had an effect
- the treatment did not have an effect
- there is not enough evidence to conclude that the treatment had an effect
Answer
- there is not enough evidence to conclude that the treatment had an effect
Randomly assigning participants to groups in an experiment helps to reduce a particular kind of bias that might occur if participants were able to select whether they wanted to be in the control group or the treatment group. Explain how randomly assigning participants to groups helps eliminate this bias.
Answer
Randomization helps ensure (as much as we can) that the groups will be similar to each other on all characteristics before the difference in treatment. If participants grouped on their own, the participants might group based on similar characteristics such as race or gender, which would make the groups very unequal before the difference in treatment.
Suppose that, in a correctly conducted randomized experiment, the mean response from participants in the control group differs from the mean response from participants in the treatment group. One reason for this is that participants in the control group were treated differently than participants in the treatment group. Indicate the other possible reason why the mean response from participants in the control group differed from the mean response from participants in the treatment group.
Answer
The other possible reason is that random assignment error caused the difference. Random assignment error refers to differences between the groups after the randomization but before the difference in treatment. So, for instance, if random assignment produced a control group that was 51% female and a treatment group that was 49% female, that 2% difference would be due to random assignment error.Suppose that researchers randomly assign each participant in a study to one group or to another group. Participants randomly assigned to the first group are asked to read a story with no images about a Black man who was convicted of a DUI, and participants randomly assigned to the second group are asked to read a story with no images about a White man who was convicted of a DUI. Except for the race of the man convicted of the DUI, everything is the same in the stories, such as the man not having a past criminal history and the man having had a 0.11 blood alcohol content. After reading the story, each participant is asked to recommend a jail sentence length for the man in the story, from 0 months to 24 months.
Results from the experiment indicated that the mean recommended sentence length was longer among participants assigned to the “Black man” group than the mean recommended sentence length among participants assigned to the “White man” group. Results also indicated that the p-value is p=0.01 for a test of the null hypothesis that the mean recommended sentence length among participants assigned to the “Black man” group equals the mean recommended sentence length among participants assigned to the “White man” group. Explain whether this is sufficient evidence at the conventional level in political science to conclude that the race of the man in the story caused this difference in mean recommended jail sentence length between experimental conditions.
Answer
Yes, in a randomized experiment, the only two reasons for a difference between the groups is [1] random assignment error or [2] the difference in treatment. The p-value under p=0.05 permits us to rule random assignment error as a plausible reason for the difference between groups, so the only remaining reason is the difference in treatment, which was the indication of the race of the man convicted of DUI.
6.5 Placebos
Major learning objective(s) for this section:
- Explain the benefit of a placebo.
A placebo is a treatment that is intended to have no effect.
Suppose that we recruit people for an experiment about the effect of a weight loss pill. If we give the pill to the treatment group but do not give a pill to the control group, then the group that got the pill might stop exercising based on the belief that the pill will work. Then, later, if results from the experiment indicate that the pill did not cause weight loss, it might be that the pill caused weight loss but the lack of exercise for the pill group caused weight gain that offset the weight loss.
Giving the control group a placebo pill means that no participant in the experiment can be sure whether they got the weight loss pill or the placebo pill, so researchers do not need to worry about one group behaving differently than the other group because of receiving the pill.
6.6 Natural experiments
A natural experiment is similar to a randomized experiment, but, in a natural experiment, nature assigns the treatment in a way that is random or at least is close to random. For example, some studies estimate the effect of having an extra child, by comparing women who give birth to twins to women who give birth to a singleton child. In many or most cases, having twins is random enough, so that, on average, there should not be substantial differences between women who give birth to a singleton child and women who give birth to twins.
Another natural experiment was used to assess the extent to which selling alcohol at baseball games influenced the amount of crime in the area after the game. By rule, a particular baseball team stopped selling alcohol at home games after the seventh inning. Most baseball games end after nine innings, so some fans are still drunk at the end of the game. But some games go into extra innings, so, if a game does not end until, say, the 15th inning, then the fans haven’t had alcohol in a long time and thus are no longer drunk. This might not be a perfect randomized experiment: for example, a good team like the New York Yankees is presumably more likely to go into extra innings against another equally-matched good team like the Houston Astros than against a bad team like the Detroit Tigers, and maybe fans at the Astros game are more or less likely to drink to drunkenness than fans at the Tigers game. But this might be such a small concern that this natural experiment is close enough to a randomized experiment to be useful for making causal inferences.
Let’s look at another example, from Bleakley and Ferrie 2016. The plot below is from non-experimental data, indicating that, compared to fathers in 1850 Georgia who had a low percentile of total wealth, fathers in 1850s Georgia who had a higher percentile of total wealth were much more likely to send their children to school. Data in the figure are cross-sectional, which means that we only observe father/son combinations at one point in time. Differences between points along the X-axis are not jumps in an individual father’s wealth, but are instead differences in wealth between different fathers at the same point in time.
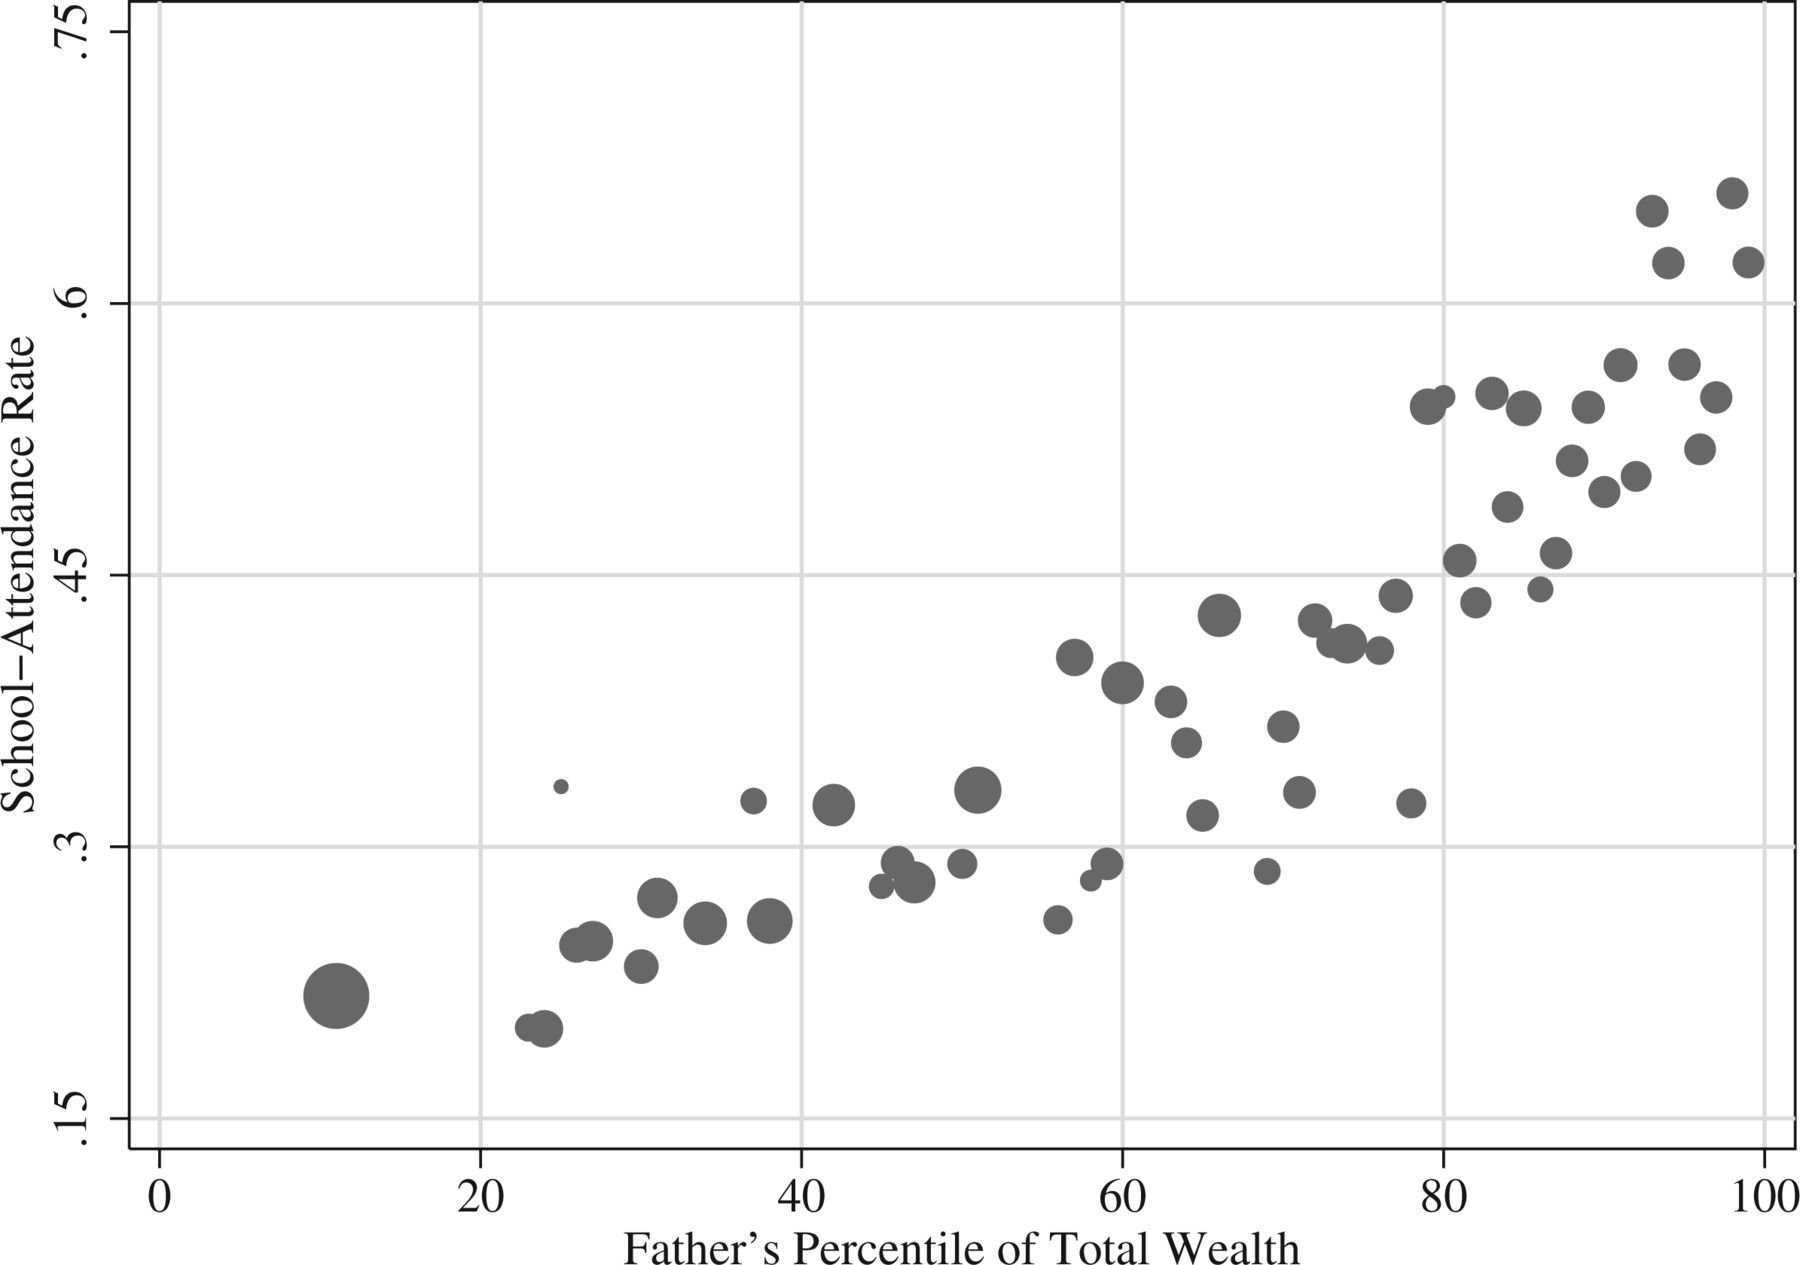
One potential explanation for this pattern is that being wealthy caused fathers to be more likely to send their children to school. But another potential explanation is that the factors that caused a father to be wealthy also caused the father to be more likely to send their children to school. The problem with correlational data is that correlational data cannot help us decide between these competing explanations.
But Bleakley and Ferrie 2016 analyzed data from an 1832 lottery in Georgia that permitted stronger causal identification. This lottery provided winners about $700, which was a substantial amount of wealth, close to median wealth at the time. Bleakely and Ferrie 2016 compared outcomes for fathers who won the lottery to outcomes for fathers who were eligible to win the lottery but did not win the lottery. The benefit of comparing lottery winners to lottery losers is that these groups should be similar to each other before the random “treatment” of winning the lottery. For example, the mean age was 51.3 among lottery losers and was 50.9 among lottery winners, the percentage that couldn’t read and write was 14.7% among lottery losers and 14.2% among lottery winners, and the number of children born within the three years prior to the lottery was 1.333 for lottery losers and was 1.332 for lottery winners.
Bleakley and Ferrie 2016 checked to see whether winning of the lottery had affected winners’ wealth in 1850, which was 18 years after the lottery. The total wealth was $3,876.50 among winners and was $3,245.50 among losers, which was a $631 difference, and the corresponding p-value of p=0.006 lets us infer that these total mean wealths differed from each other. However, as measured after the lottery, the school attendance rate among the children of lottery winners was almost identical to the school attendance rate among lottery losers: 34.2% for losers and 34.1% for winners (p=0.799). This experimental result strongly suggests that the correlation in the figure was not a causal association.
Sample practice items
Which one of the following indicates a difference between a randomized experiment and a natural experiment?
- In a natural experiment, the experiment must be conducted outside.
- In a natural experiment, the assignment of the treatment must be done by nature or as if by nature.
- In a natural experiment, the outcome variable must be a measure of a natural phenomenon.
- In a natural experiment, computers must not be used for the data analysis.
Answer
- In a natural experiment, the assignment of the treatment must be done by nature or as if by nature.