9 Imperfect indicators of quality
9.1 Peer review
Major learning objective(s) for this section:
- Know what peer review typically involves and does not involve.
Research can be flawed. One method that researchers use to reduce these flaws is peer review, in which persons knowledgeable in a research field review a research paper before the research paper can be published in a peer-reviewed journal. The journal’s editor then typically uses the peer reviewer comments to determine whether to publish the paper as is, to request a revised paper, or to reject the paper. The hope is that this peer review process will:
- improve the paper
- provide a signal about the quality of the paper
This signal has multiple parts. The signal can indicate that this paper has sufficient quality to be published, but this signal can also indicate that this paper is important enough or good enough to be published in the journal that is reviewing the paper.
Political science and many other social sciences often use double-blind peer review, in which the author of a submitted paper does not know who the peer reviewers are, and the peer reviewers do not know who the author is. Peer reviewers receive a paper that does not indicate the author’s name, and the author receives peer reviews that do not indicate the peer reviewers’ names. A benefit of double-blind peer review is that the peer reviewers will hopefully evaluate the work instead of evaluating the person who submitted the work; another benefit is that, because the reviewers’ names are kept confidential, the reviewers cannot be punished by the author if the reviewer writes a negative review. A disadvantage of double-blind peer review is that—because the peer reviewers’ names are kept confidential—the peer reviews are sometimes of lower quality than they should be, because the peer reviewers do not get credit for writing a good peer review and are shielded from criticism for writing a bad review.
Natural sciences such as biology and physics typically use single-blind peer review, in which the author does not know who the peer reviewers are, but the peer reviewers know who the author is. One possible advantage of single-blind peer review is in decisions about funding grants. Peer reviewers evaluating the person who submitted the work can help decide whether to trust a researcher with grant money, because peer reviewers might have information about whether the researcher is trustworthy and/or has used grant money wisely in the past and/or does a good and fair job with data analysis. The disadvantage of single-blind peer review is that the peer reviewers might bias their evaluation of the paper because the peer reviewer does not like the paper’s author.
A few journals use triple-blind peer review, which is the same as double-blind review, but with an extra layer of blindness: the journal editor does not know who the author of the paper is. The benefit of this triple-blind peer review is that the editor’s judgment is not influenced by author characteristics. Editors might favor some authors in the decision to publish or in the decision of whom to invite for peer review (if the editor knows which peers provide “easy” reviews). But a drawback of triple-blind peer review is that it is more difficult logistically, so the journal needs an extra layer of review with assistants to help make sure that the editor does not accidentally invite for peer review a co-author of the author of the paper. (Journals typically do not invite peers who have a close connection to the paper’s author, such as co-authors, past advisers, or persons who work in the same department as the author).
Another (relatively uncommon) type of peer review is open peer review, in which the author(s), peer reviewers, and editor(s) all know each others’ names, and the paper and the peer reviews are posted on the internet with names attached to the paper and the reviews. A drawback to open peer review is that the review of the paper might be biased because the reviewer does not like the paper’s author. But advantages of open peer review are that this bias would be more easily detectable and that peer reviewers could be rewarded and/or punished for good reviews and bad reviews.
Blindness in peer review is not always true blindness, because occasionally even under double-blind review, peer reviewers might know who the paper’s author is because, for instance, the author has already publicly presented the paper at a conference. Moreover, the peer reviewers typically do not check the data to make sure that the data has been coded correctly and do not check the statistical analysis to make sure that the statistical analysis has been conducted correctly. Peer review typically involves only the peer reviewers and editors evaluating the research by reading the research paper.
Peer review is therefore not a seal of approval from the scientific community, but instead is more of an attempt to make sure that the paper crosses a minimum threshold of quality for the journal. Peer review does not catch all flaws and biases in research, so it’s a good idea for readers to assess the research on their own.
Let’s discuss a post on the Monkey Cage political science blog at the Washington Post, which published an analysis by Feinberg et al:
We found that counties that had hosted a 2016 Trump campaign rally saw a 226 percent increase in reported hate crimes over comparable counties that did not host such a rally.
One obvious question that this Feinberg et al study did not address was the corresponding percentage increase in hate crimes in counties that hosted a 2016 Hillary Clinton rally. Maybe Trump rallies associated with hate crimes merely because Trump held rallies in large population counties, and large population counties tend to have a larger number of hate crimes, at least partly because large counties have a large number of people who live there. Matthew Lilley and Brian Wheaton ran the numbers and reported in a Reason magazine post from September 2019 that:
Using additional data we collected, we also analyzed the effect of Hillary Clinton’s campaign rallies using the identical statistical framework. The ostensible finding: Clinton rallies contribute to an even greater increase in hate incidents than Trump rallies.
Believe it or not, more than two years after the Lilley and Wheaton criticism was published, the Feinberg et al analysis limited to Trump rallies was published in a peer-reviewed journal.
Quantitative reasoning isn’t always easy, and quantitative reasoning can be even more difficult if quantitative results are reported with errors or in a misleading way. And peer review doesn’t always prevent publication of erroneous or misleading results. A major goal of this POL 138 course is to help you identify and avoid bad quantitative reasoning.
Sample practice items
During peer review of papers that report a statistical analysis, is it typical for the peer reviewers to check the data to see whether the statistical analysis is correctly conducted?
- Yes
- No
Answer
- No
Which of the following is correct about double-blind peer review?
- The peer reviewers are told the name of the author of the paper being reviewed.
- The peer reviewers are NOT told the name of the author of the paper being reviewed.
Answer
- The peer reviewers are NOT told the name of the author of the paper being reviewed.
Which of the following is correct about singe-blind peer review?
- The peer reviewers are told the name of the author of the paper being reviewed.
- The peer reviewers are NOT told the name of the author of the paper being reviewed.
Answer
- The peer reviewers are told the name of the author of the paper being reviewed.
In single-blind peer review, the only formal blindness is to not tell the authors the names of the peer reviewers. In single-blind peer review, the peer reviewers are told the name(s) of the author(s) of the paper that is under review.
9.2 Pre-registration
Major learning objective(s) for this section:
- Know what pre-registration is.
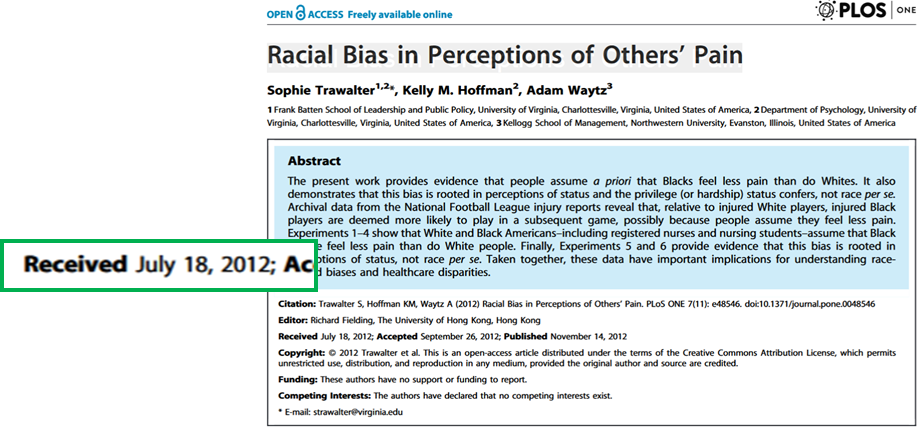
Trawalter et al 2012 lists the date that the manuscript was received as July 18, 2012:
 None of the studies reported in Trawalter et al 2012 had a large representative sample:
- Experiment 1: 240 whites from the University of Virginia psychology pool or MTurk
- Experiment 2: 35 blacks from the University of Virginia psychology pool or MTurk
- Experiment 3: 43 registered nurses or nursing students
- Experiment 4: 60 persons from MTurk
- Experiment 5: 104 persons from MTurk
- Experiment 6: 245 persons from MTurk
However, the lead author of the Trawalter et al 2012 study was the principal investigator for a federally funded national survey – with a sample of more than 2,000 respondents! – that was conducted in 2011 and was entitled “Racial Bias in Perceptions of Others’ Pain”, which is the same title as the 2012 Trawalter et al 2012 article:
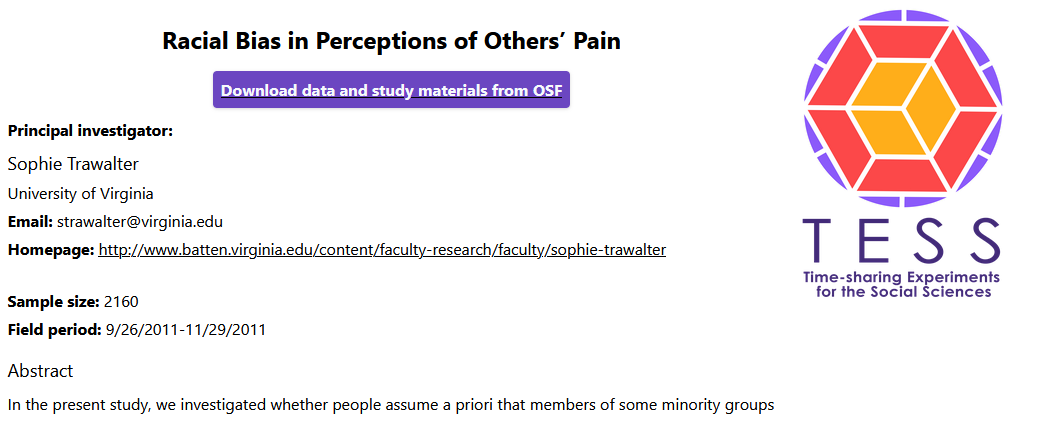
The Trawalter et al 2012 article did not mention results from the national survey, which were at best mixed.
Flawed research practices, such as selective reporting of results, plausibly contributes to the Replication Crisis, which is a phenomenon in social science in which researchers conducing new studies have been getting smaller effect sizes than prior studies have gotten and have sometimes not been able to replicate a prior effect at all. This replication crisis might be partly due to selective reporting.
Franco et al 2014 found an interesting way to assess how often researchers don’t publish on their experiments. The Time-sharing Experiments for the Social Sciences program (TESS) is a federally-funded program that accepts proposals for survey experiments, reviews the proposals, funds data collection for accepted proposals, gives the data to the proposal authors for a year, and then posts the data and survey questionnaire online. Franco et al checked to see how often these data were not published. Of the 235 survey experiment studies with data, 52% were not published at the time that the Franco et al data analysis was conducted. Franco et al also found that null results were much more likely to remain unpublished (65% unpublished for null results vs. 4% unpublished for strong results). Franco et al 2015 found that:
“…about 40% of studies fail to fully report all experimental conditions and about 70% of studies do not report all outcome variables included in the questionnaire. Reported effect sizes are about twice as large as unreported effect sizes and are about 3 times more likely to be statistically significant.”
One method to reduce selective reporting is pre-registration, in which researchers publicly post ahead of time a plan for the research that they will conduct. This plan might include information such as when the data will be collected, from whom or what the data will be collected, what data will be collected, how the data will be analyzed, and what analyses will be reported. See this link for a sample preregistration. One potential flaw of pre-registration is that researchers will deviate from the preregistration plan and that peer review will not catch this deviation, such as this example.
Another potential contributor to the replication crisis is fraud.
9.2.1 Sample practice items
In the past few years, there have been several unsuccessful attempts to get the same results as prior studies have gotten. This is referred to as…
- the ecological fallacy
- the file drawer problem
- the replication crisis
- the reproduction conundrum
- Simpson’s paradox
Answer
- the replication crisis
9.3 Meta-analysis
Major learning objective(s) for this section:
- Know how a meta-analysis works.
- Combine effect sizes weighted by study sample sizes.
A meta-analysis is a study of studies (i.e., at a “meta” level). These meta-analyses pool together other studies to get a better sense of what the literature as a whole has found about a research question. Meta-analyses often combine studies through weighted analyses, because some studies provide more information about the research question. For example, a study that had 400 participants has likely provided more evidence about the research question than a study that had 100 participants has provided.
The meta-analysis method suffers from a garbage-in garbage-out problem: if the studies that are included in the meta-analysis are biased, then the meta-analysis estimate might also be biased. Another problem is that a meta-analysis might not include all studies that have been conducted on a topic. Sometimes researchers who test a hypothesis and do not find evidence for the hypothesis might decide to not report these results. For one thing, it is often more difficult to publish null results, because null results are ambiguous: did the study not detect an effect because the effect doesn’t exist, or because the study wasn’t good enough to detect the effect? If null results are not included in a meta-analysis, then the meta-analysis might overestimate an effect.
Nonetheless, an estimate from a meta-analysis is plausibly better than an estimate from any single non-preregistered study that is included in the meta-analysis. Moreover, researchers who conduct a meta-analysis often take steps to reduce problems of not including all conducted studies. For example, the researchers might contact other researchers who work on the topic and ask these researchers if the researcher has unreported studies. Researchers conducting a meta-analysis also can search for unpublished studies that have been posted on the internet, and researchers have statistical techniques that can try to address selective reporting.
Sample practice items
Explain why a meta-analysis might be better than a single well-done study as a source for information about a research question.
Answer
Meta-analyses collect data from multiple studies, so these meta-analyses should have larger sample sizes than an individual study in the meta-analysis and thus have more information. Moreover, meta-analyses collect data from different studies, so any particular idiosyncrasy from a study should hopefully even out or be overpowered when combined with other studies.Explain whether a meta-analysis should include studies that have never been published in a peer-reviewed journal.
Answer
Not all well-done studies are published in a peer-reviewed journal. But a well-done study can help us get the correct estimate for a research question, so a meta-analysis should include studies that have not been published in a peer-reviewed journal. If a study is to be excluded from a meta-analysis because the study is poorly done, then such a judgment of quality is better done by checking the research design of the study, instead of merely assuming that non-peer-reviewed studies are not well done. Moreover, compared to a study that detected an effect, it is typically more difficult to publish a study that does not detect an effect, so studies published in a peer-reviewed journal might be biased to overestimate the true effect size; one way to address this bias is to include studies that were not published in a peer-reviewed journal.Suppose that, on a particular research question, all of the studies that have been conducted have had small sample sizes, so that none of the studies has been able to find what the study was looking for. However, we have data on all of the studies that have been conducted on this research question. Should it be expected that aggregating the studies into a meta-analysis would reduce this flaw of a too-small sample size?
Answer
Yes. This flaw of too-small sample sizes can be addressed by combining studies to get a larger sample size.Suppose that, on a particular research question, all of the studies that have been conducted have had a flawed research design that biased the estimates to be smaller than the true value. Should it be expected that aggregating the studies into a meta-analysis would reduce this flaw of a biased research design?
Answer
No. This flaw of a biased research design would not be addressed by combining studies to get a larger sample size.Explain why, for a meta-analysis, calculating an average by weighting studies by sample size might produce a better estimate than a simple average of the effect size across studies.
Answer
If studies are merely averaged together, then a small sample study would count as much toward the overall average as a large sample study does. But if the studies are weighted by sample size, then the larger sample studies (which provide more evidence) will count more toward the overall average.Compared to a meta-analysis in which studies are unweighted, a meta-analysis in which studies are weighted will ___ have a larger mean estimate.
- sometimes
- always
- never
Answer
- sometimes
Study A has an estimated effect of 3 units and a sample size of 100 participants. Study B has an estimated effect of 2 units and a sample size of 200 participants. Which study should receive more weight in a meta-analysis?.
- Study A, because it has a larger effect size
- Study B, because it has a larger sample size
Answer
- Study B, because it has a larger sample size
This topic of meta-analysis will give us another chance to practice calculating weighted means. In a meta-analysis, some studies are often given more emphasis than other studies are given, because, for example, studies with a larger sample provide more information than studies will a smaller sample provide. Let’s calculate a mean estimated effect size from the studies listed in the table below, with the estimate weighted by sample size:
| Study | Effect size | Sample size |
|---|---|---|
| A | 4 | 200 |
| B | 6 | 800 |
| C | 12 | 1000 |
First, let’s get the total sample size, which is 200 + 800 + 1000, or 2000. Then let’s calculate the weight to apply to each study, which in this case is the percentage of the total sample size that the study represents:
| Study | Effect size | Sample size | Weight |
|---|---|---|---|
| A | 4 | 200 | 200 / 2000 = 0.10 |
| B | 6 | 800 | 800 / 2000 = 0.40 |
| C | 12 | 1000 | 1000 / 2000 = 0.50 |
Now, for each study, let’s multiply the estimated effect size by the weight, and then add together those numbers:
4*(0.10) + 6*(0.40) + 12*(0.50) = 8.8
The last step is to see whether the weighted mean estimated effect size makes sense, because the weighted mean should at least be between the lowest estimated effect size and the highest estimated effect size.
Another way to think about this is that Study A has 200 participants that produced an effect size estimate of 4, so we can treat that as 200 “4”s. And we can treat Study B as 800 “6”s. And treat Study C as 1000 “12”s. So, in total we would have:
(200*4) + (800*6) + (1000*12) = 17,600
That’s 17,600 total “effect sizes”. Then, to calculate the average effect size, we can divide by the total effect size by the total sample size of 2,000, to get 17,600 \(\div\) 2,000, which is 8.8.
The basic steps in a meta-analysis, when combining studies by weighting on sample size:
- Calculate the total sample size.
- Calculate the percentage that each study contributes to the total sample size.
- Multiply each percentage from Step 2 by the corresponding effect size.
- Add together all the numbers from Step 3.
Sample practice items
Calculate the mean effect size across the studies below, weighted by sample size.
| Study | Sample size | Effect size |
|---|---|---|
| A | 200 | 5 |
| B | 600 | 2 |
Answer
Total sample size is 200+600 or 800.
5*(200/800) + 2*(600/800) = 2.75Note that Study B has three times the sample size of Study A, so that’s like weighting Study B by three times as much. So an alternate calculation is to take the average of a set of numbers in which Study B’s effect size appears three times as often as Study A’s effect size: (2+2+2+5)/4 = 2.75
Calculate the mean effect size across the studies below, weighted by sample size.
| Study | Sample size | Effect size |
|---|---|---|
| A | 100 | 20 |
| B | 300 | 50 |
| C | 800 | 10 |
Answer
Total sample size is 100+300+800 or 1200.
20*(100/1200) + 50*(300/1200) + 10*(800/1200) = 20.8