Political Research Quarterly published Huber and Gunderson 2022 "Putting a fresh face forward: Does the gender of a police chief affect public perceptions?". Huber and Gunderson 2022 reports on a survey experiment in which, for one of the manipulations, a police chief was described as female (Christine Carlson or Jada Washington) or male (Ethan Carlson or Kareem Washington).

---

Huber and Gunderson 2022 has a section called "Heterogeneous Responses to Treatment" that reports on results that divided the sample into "high sexism" respondents and "low sexism" respondents. For example, the mean overall support for the female police chief was 3.49 among "low sexism" respondents and was 3.41 among "high sexism" respondents, with p=0.05 for the difference. Huber and Gunderson 2022 (p. 8) claims that [sic on the absence of a "to"]:

These results indicate that respondents' sexism significantly moderates their support for a female police chief and supports role congruity theory, as individuals that are more sexist should react more negatively [sic] violations of gender roles.

But, for all we know from the results reported in Huber and Gunderson 2022, "high sexism" respondents might merely rate police chiefs lower relative to how "low sexism" respondents rate police chiefs, regardless of the gender of the police chief.

Instead of the method in Huber and Gunderson 2022, a better method to test whether "individuals that are more sexist...react more negatively [to] violations of gender roles" is to estimate the effect of the male/female treatment on ratings about the police chief among "high sexism" respondents. And, to test whether "respondents' sexism significantly moderates their support for a female police chief", we can compare the results of that test to results from a corresponding test among "low sexism" respondents.

---

Using the data and code for Huber and Gunderson 2022, I ran the code up to the section for Table 4, which is the table about sexism. I then ran my modified code of the Huber and Gunderson 2022 code for Table 4, among respondents Huber and Gunderson 2022 labeled "high sexism", which is for a score above 0.35 on the measure of sexism, and then among respondents Huber and Gunderson 2022 labeled "low sexism", which is for a score below 0.35 on the measure of sexism.

Results are below, indicating a lack of p<0.05 evidence for a male/female treatment effect among these "high sexism" respondents, along with a p<0.05 pro-female bias among the "low sexism" respondents on all but one of the Table 4 items.

HIGH SEXISM RESPONDENTS------------------
                     Female Male
                     Chief  Chief
Domestic Violence    3.23   3.16  p=0.16
Sexual Assault       3.20   3.16  p=0.45
Violent Crime Rate   3.20   3.23  p=0.45
Corruption           3.21   3.18  p=0.40
Police Brutality     3.17   3.17  p=0.94
Community Leaders    3.33   3.31  p=0.49
Police Chief Support 3.41   3.39  p=0.52

LOW SEXISM RESPONDENTS------------------
                     Female Male
                     Chief  Chief
Domestic Violence    3.40   3.21  p<0.01
Sexual Assault       3.44   3.22  p<0.01
Violent Crime Rate   3.40   3.33  p=0.10
Corruption           3.21   3.07  p=0.01
Police Brutality     3.24   3.11  p=0.01
Community Leaders    3.40   3.32  p=0.02
Police Chief Support 3.49   3.37  p<0.01

---

I'm sure that there might be more of interest, such as calculating p-values for the difference between the treatment effect among "low sexism" respondents and the treatment effect among "high sexism" respondents, and assessing whether there is stronger evidence of a treatment effect among "high sexism" respondents higher up the sexism scale than the 0.35 threshold used in Huber and Gunderson 2022.

But I at least wanted to document another example of a pro-female bias among "low sexism" respondents.

Tagged with: , , , ,

The Journal of Politics recently published Butler et al 2022 "Constituents ask female legislators to do more".

---

1. PREREGISTRATION

The relevant preregistration plan for Butler et al 2022 has an outcome that the main article does not mention, for the "Lower Approval for Women" hypothesis. Believe it or not, the Butler et al 2022 analysis didn’t find sufficient evidence in its "Lower Approval for Women" tests. So instead of reporting that in the JOP article or its abstract or its title, Butler et al mentioned the insufficient evidence in appendix C of the online supplement to Butler et al 2022.

---

2. POSSIBLE ERROR FOR THE APPROVAL HYPOTHESIS

The Butler et al 2022 online appendix indicates that the dependent variable for Table C2 is a four-point scale that was predicted using ordered probit. Table C2 reports results for four cut points, even though a four-point dependent variable should have only three cut points. The dependent variable was drawn from a 5-point scale in which the fifth point was "Not sure", so I think that someone forgot to recode the "Not sure" responses to missing.

Butler et al 2022 online appendix C indicates that:

Constituents chose among 5 response options for the question: Strongly approve, Somewhat approve, Somewhat disapprove, Strongly disapprove, Not sure.

So I think that the "Not sure" responses were coded as if being not sure was super strongly disapprove.

---

3. PREREGISTRATION + RESEARCH METHOD

The image below has a tabulation of the dependent variable for the preregistered hypothesis of Butler et al 2022 that is reported in the main text, the abstract, and the title:

That's a very large percentage of zeros.

The Butler et al 2022 experiment involved male legislators and female legislators sending letters to constituents asking the constituents to complete an online survey, and, in that online survey, the legislator asked "What policy issues do you think I should work on during the current session?".

Here is a relevant passage from the Butler et al 2022 preregistration reported in the online appendix, with my emphasis added and [sic] for "...condition the code...":

Coding the Dependent Variable. This would be an open-ended question where voters could list multiple issues. We will have RAs who are blind to the hypothesis and treatment condition the code the number of issues given in the open response. We will use that number as the dependent variable. We will then an OLS regression where the DV is the number of issues and the IV is the gender treatment.

That passage seems to indicate that the dependent variable was preregistered to be a measure about what constituents provided in the open response. From what I can tell based on the original coding of the "NumberIssues" dependent variable, the RAs coded 14 zeros based on what respondents provided in the open response, out of a total of 1,203 observations. I ran the analysis on only these 1,203 observations, and the coefficient for the gender of the legislator (fem_treatment) was p=0.29 without controls and p=0.29 with controls.

But Butler et al 2022 coded the dependent variable to be zero for the 29,386 people who didn't respond to the survey at all or at least didn't respond in the open response. Converting these 29,386 observations to zero policy issues asked about produces corresponding p-values of p=0.06 and p=0.09. But it seems potentially misleading to focus on a dependent variable that conflates [1] the number of issues that a constituent asked about and [2] the probability that the constituent responded to the survey.

Table D2 of Butler et al 2022 indicates that constituents were more likely to respond to the female legislators' request to respond to the online survey (p<0.05). Butler et al 2022 indicates that "Women are thus contacted more often but do not receive more requests per contact" (p. 2281). But it doesn't seem correct to describe a higher chance of responding to a female legislator's request to complete a survey as contacting female legislators more, especially if the suggestion is that the experimental results about contact initiated by the legislator applies to contact that is not initiated by the legislator.

If anything, constituents being more likely to respond to female legislator requests than male legislator requests seems like a constituent bias in favor of female legislators.

---

NOTE

1. To date, no responses to tweets about the potential error or the research method.

Tagged with: , ,

Politics & Gender published Deckman and Cassese 2021 "Gendered nationalism and the 2016 US presidential election", which, in 2022, shared an award for the best article published in Politics & Gender the prior year.

---

1.

So what is gendered nationalism? From Deckman and Cassese 2021 (p. 281):

Rather than focus on voters' sense of their own masculinity and femininity, we consider whether voters characterized American society as masculine or feminine and whether this macro-level gendering, or gendered nationalism as we call it, had political implications in the 2016 presidential election.

So how is this characterization of American society as masculine or feminine measured? The Deckman and Cassese 2021 online appendix indicates that gendered nationalism is...

Measured with a single survey item asking whether "Society as a whole has become too soft and feminine." Responses were provided on a four-point Likert scale ranging from strongly disagree to strongly agree.

So the measure of "whether voters characterized American society as masculine or feminine" (p. 281) ranged from the characterization that American society is (too) feminine to the characterization that American society is...not (too) feminine. The "(too)" is because I suspect that respondents might interpret the "too" in "too soft and feminine" as also applying to "feminine", but I'm not sure it matters much.

Regardless, there are at least three potential relevant characterizations: American society is feminine, masculine, or neither feminine nor masculine. It seems like a poor research design to combine two of these characterizations.

---

2.

Deckman and Cassese 2021 also described gendered nationalism as (p. 278):

Our project diverges from this work by focusing on beliefs about the gendered nature of American society as a whole—a sense of whether society is 'appropriately' masculine or has grown too soft and feminine.

But disagreement with the characterization that "Society as a whole has become too soft and feminine" doesn't necessarily indicate a characterization that society is "appropriately" masculine, because a respondent could believe that society is too masculine or that society is neither feminine nor masculine.

Omission of a response option indicating a belief that American society is (too) masculine might have made it easier for Deckman and Cassese 2021 to claim that "we suppose that those who rejected gendered nationalism were likely more inclined to vote for Hillary Clinton" (p. 282), as if only the measured "too soft and feminine" characterization is acceptance of "gendered nationalism" and not the unmeasured characterization that American society is (too) masculine.

---

3.

Regression results in Table 2 of Deckman and Cassese 2021 indicate that gendered nationalism predicts a vote for Trump over Clinton in 2016, net of controls for political party, a single measure of political ideology, and demographics such as class, race, and education.

Gendered nationalism is the only specific belief in the regression, and Deckman and Cassese 2021 reports no evidence about whether "beliefs about the gendered nature of American society as a whole" has any explanatory power above other beliefs about gender, such as gender roles and animus toward particular genders.

---

4.

Deckman and Cassese 2021 reported on four categories of class: lower class, working class, middle class, and upper class. Deckman and Cassese 2021 hypothesis H2 is that:

Gendered nationalism is more common among working-class men and women than among men and women with other socioeconomic class identifications.

For such situations, in which the hypothesis is that one of four categories is distinctive, the most straightforward approach is to omit from the regressions the hypothesized distinctive category, because then the p-values and coefficients for each of the three included categories will provide information about the evidence that that included category differs from the omitted category.

But the regressions in Deckman and Cassese 2021 omitted middle class, and, based on the middle model in Table 1, Deckman and Cassese 2021 concluded that:

Working-class Democrats were significantly more likely to agree that the United States has grown too soft and feminine, consistent with H2.

But the coefficients and standard errors were 0.57 and 0.26 for working class and 0.31 and 0.40 for lower class, so I'm not sure that the analysis in Table 1 contained enough evidence that the 0.57 estimate for working class differs from the 0.31 estimate for lower class.

---

5.

I think that Deckman and Cassese 2021 might have also misdescribed the class results in the Conclusions section, in the passage below, which doesn't seem limited to Democrat participants. From p. 295:

In particular, the finding that working-class voters held distinctive views on gendered nationalism is compelling given that many accounts of voting behavior in 2016 emphasized support for Donald Trump among the (white) working class.

For that "distinctive" claim, Deckman and Cassese 2021 seemed to reference differences in statistical significance (p. 289, footnote omitted):

The upper- and lower-class respondents did not differ from middle-class respondents in their endorsement of gendered nationalism beliefs. However, people who identified as working class were significantly more likely to agree that the United States has grown too soft and feminine, though the effect was marginally significant (p = .09) in a two-tailed test. This finding supports the idea that working-class voters hold a distinctive set of beliefs about gender and responded to the gender dynamics in the campaign with heightened support for Donald Trump’s candidacy, consistent with H2.

In the Table 1 baseline model predicting gendered nationalism without interactions, ologit coefficients are 0.25 for working class and 0.26 for lower class, so I'm not sure that there is sufficient evidence that working class views on gendered nationalism were distinctive from lower class views on gendered nationalism, even though the evidence is stronger that the 0.25 working class coefficient differs from zero than the 0.26 lower class coefficient differs from zero.

Looks like the survey's pre-election wave had at least twice as many working class respondents as lower class respondents. If that ratio was similar for the post-election wave, that would explain the difference in statistical significance and explain why the standard error was smaller for the working class (0.15) than for the lower class (0.23). Search for "class" at the PRRI site and use the PRRI/The Atlantic 2016 White Working Class Survey.

---

6.

At least Deckman and Cassese 2021 interpreted the positive coefficient on the interaction of college and Republican as an estimate of how the association of college and the outcome among Republicans differed from the association of college and the outcome among the omitted category.

But I'm not sure of the justification for "largely" in Deckman and Cassese 2021 (p. 293):

Thus, in accordance with our mediation hypothesis (H5), gender differences in beliefs that the United States has grown too soft and feminine largely account for the gender gap in support for Donald Trump in 2016.

Inclusion of the predictor for gendered nationalism pretty much only halves the logit coefficient for "female", from 0.80 to 0.42, and, in Figure 3, the gender gap in predicted probability of a Trump vote is pretty much only cut in half, too. I wouldn't call about half "largely", especially without addressing the obvious confound of attitudes about men and women that have nothing to do with "gendered nationalism".

---

7.

Deckman and Cassese 2021 was selected for a best article award by the editorial board of Politics & Gender. From my prior posts on publications in Politics & Gender: p < .000, misinterpreted interaction terms, and an example of the difference in statistical signifiance being used to infer an difference in effect.

---

NOTES

1. Prior post mentioning Deckman and Cassese 2021.

2. Prior post on deviations from a preregistration plan, for Cassese and Barnes 2017.

3. "Gendered nationalism" is an example of use of a general term when a better approach would be specificity, such as a measure that separates "masculine nationalism" from "feminine nationalism". Another example is racial resentment, in which a general term is used to describe only the type of racial resentment directed at Blacks. Feel free to read through participant comments in the Kam and Burge survey, in which plenty of comments from respondents who score low on the racial resentment scale indicate resentment directed at Whites.

Tagged with: , , ,

Research involves a lot of decisions, which in turn provides a lot of opportunities for research to be incorrect or substandard, such as mistakes in recoding a variable, not using the proper statistical method, or not knowing unintuitive elements of statistical software such as how Stata treats missing values in logical expressions.

Peer and editorial review provides opportunities to catch flaws in research, but some journals that publish political science don't seem to be consistently doing a good enough job at this. Below, I'll provide a few examples that I happened upon recently and then discuss potential ways to help address this.

---

Feinberg et al 2022

PS: Political Science & Politics published Feinberg et al 2022 "The Trump Effect: How 2016 campaign rallies explain spikes in hate", which claims that:

Specifically, we established that the words of Donald Trump, as measured by the occurrence and location of his campaign rallies, significantly increased the level of hateful actions directed toward marginalized groups in the counties where his rallies were held.

After Feinberg et al published a similar claim in the Monkey Cage in 2019, I asked the lead author about the results when the predictor of hosting a Trump rally is replaced with a predictor of hosting a Hillary Clinton rally.

I didn't get a response from Ayal Feinberg, but Lilley and Wheaton 2019 reported that the point estimate for the effect on the count of hate-motivated events is larger for hosting a Hillary Clinton rally than for hosting a Donald Trump rally. Remarkably, the Feinberg et al 2022 PS article does not address the Lilley and Wheaton 2019 claim about Clinton rallies, even though the supplemental file for the Feinberg et al 2022 PS article discusses a different criticism from Lilley and Wheaton 2019.

The Clinton rally counterfactual is an obvious way to assess the claim that something about Trump increased hate events. Even if the reviewers and editors for PS didn't think to ask about the Clinton rally counterfactual, that counterfactual analysis appears in the Reason magazine criticism that Feinberg et al 2022 discusses in its supplemental files, so the analysis was presumably available to the reviewers and editors.

Will May has published a PubPeer comment discussing other flaws of the Feinberg et al 2022 PS article.

---

Christley 2021

The impossible "p < .000" appears eight times in Christley 2021 "Traditional gender attitudes, nativism, and support for the Radical Right", published in Politics & Gender.

Moreover, Christley 2021 indicates that (emphasis added):

It is also worth mentioning that in these data, respondent sex does not moderate the relationship between gender attitudes and radical right support. In the full model (Appendix B, Table B1), respondent sex is correlated with a higher likelihood of supporting the radical right. However, this finding disappears when respondent sex is interacted with the gender attitudes scale (Table B2). Although the average marginal effect of gender attitudes on support is 1.4 percentage points higher for men (7.3) than it is for women (5.9), there is no significant difference between the two (Figure 5).

Table B2 of Christley 2021 has 0.64 and 0.250 for the logit coefficient and standard error for the "Male*Gender Scale" interaction term, with no statistical significance asterisks; the 0.64 is the only table estimate without results reported to three decimal places, so it's not clear to me from the table if the asterisks are missing or is the estimate should be, say, 0.064 instead of 0.64. The sample size for the Table B2 regression is 19,587, so a statistically significant 1.4-percentage-point difference isn't obviously out of the question, from what I can tell.

---

Hua and Jamieson 2022

Politics, Groups, and Identities published Hua and Jamieson 2022 "Whose lives matter? Race, public opinion, and military conflict".

Participants were assigned to a control condition with no treatment, to a placebo condition with an article about baseball gloves, or to an article about a U.S. service member being killed in combat. The experimental manipulation was the name of the service member, intended to signal race: Connor Miller, Tyrone Washington, Javier Juarez, Duc Nguyen, and Misbah Ul-Haq.

Inferences from Hua and Jamieson 2022 include:

When faced with a decision about whether to escalate a conflict that would potentially risk even more US casualties, our findings suggest that participants are more supportive of escalation when the casualties are of Pakistani and African American soldiers than they are when the deaths are soldiers from other racial–ethnic groups.

But, from what I can tell, this inference of participants being "more supportive" depending on the race of the casualties is based on differences in statistical significance when each racial condition is compared to the control condition. Figure 5 indicates a large enough overlap between confidence intervals for the racial conditions for this escalation outcome to prevent a confident claim of "more supportive" when comparing racial conditions to each other.

Figure 5 seems to plot estimates from the first column in Table C.7. The largest racial gap in estimates is between the Duc Nguyen condition (0.196 estimate and 0.133 standard error) and the Tyrone Washington condition (0.348 estimate and 0.137 standard error). So this difference in means is 0.152, and I don't think that there is sufficient evidence to infer that these estimates differ from each other. 83.4% confidence intervals would be about [0.01, 0.38] and [0.15, 0.54].

---

Walker et al 2022

PS: Political Science & Politics published Walker et al 2022 "Choosing reviewers: Predictors of undergraduate manuscript evaluations", which, for the regression predicting reviewer ratings of manuscript originality, interpreted a statistically significant -0.288 OLS coefficient for "White" as indicating that "nonwhite reviewers gave significantly higher originality ratings than white reviewers". But the table note indicates that the "originality" outcome variable is coded 1 for yes, 2 for maybe, and 3 for no, so that the "higher" originality ratings actually indicate lower ratings of originality.

Moreover, Walker et al 2022 claims that:

There is no empirical linkage between reviewers' year in school and major and their assessment of originality.

But Table 2 indicates p<0.01 evidence that reviewer major associates with assessments of originality.

And the "a", "b", and "c" notes for Table 2 are incorrectly matched to the descriptions; for example, the "b" note about the coding of the originality outcome is attached to the other outcome.

The "higher originality ratings" error has been corrected, but not the other errors. I mentioned only the "higher" error in this tweet, so maybe that explains that. It'll be interesting to see if PS issues anything like a corrigendum about "Trump rally / hate" Feinberg et al 2022, given that the flaw in Feinberg et al 2022 seems a lot more important.

---

Fattore et al 2022

Social Science Quarterly published Fattore et al 2022 "'Post-election stress disorder?' Examining the increased stress of sexual harassment survivors after the 2016 election". For a sample of women participants, the analysis uses reported experience being sexually harassed to predict a dichotomous measure of stress due to the 2016 election, net of controls.

Fattore et al 2022 Table 1 reports the standard deviation for a presumably multilevel categorical race variable that ranges from 0 to 4 and for a presumably multilevel categorical marital status variable that ranges from 0 to 2. Fattore et al 2022 elsewhere indicates that the race variable was coded 0 for white and 1 for minority, but indicates that the marital status variable is coded 0 for single, 1 for married/coupled, and 2 for separated/divorced/widowed, so I'm not sure how to interpret regression results for the marital status predictor.

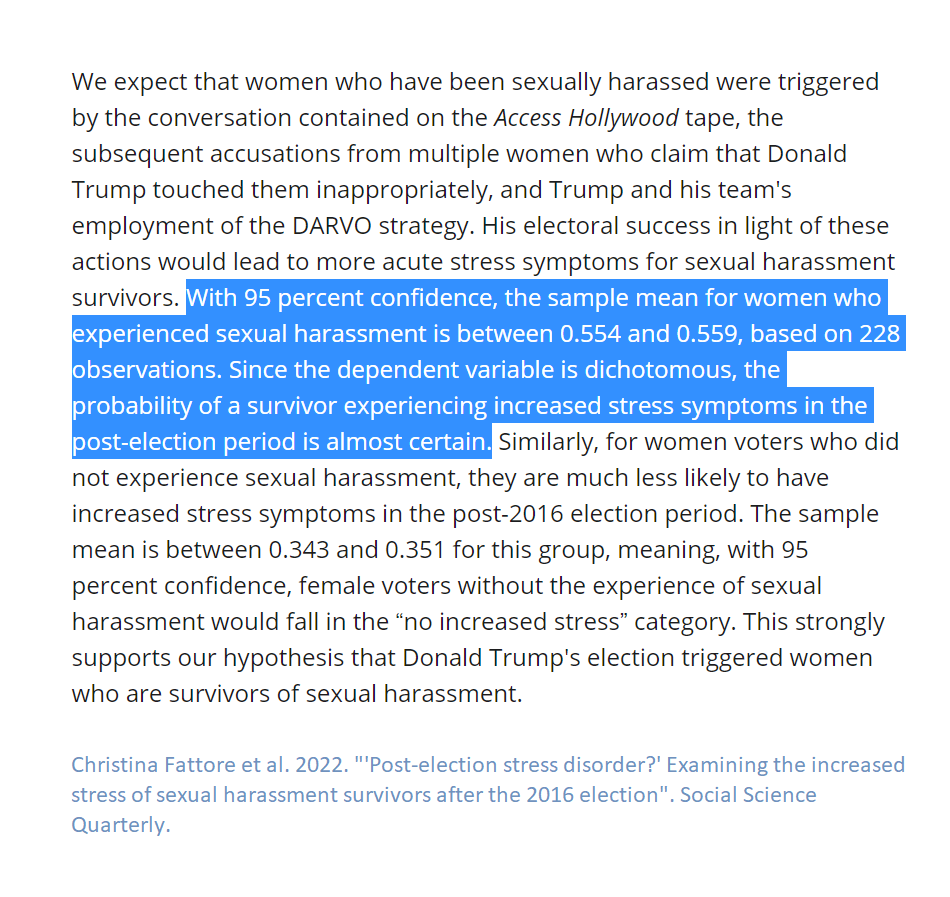
And Fattore et al 2022 has this passage:

With 95 percent confidence, the sample mean for women who experienced sexual harassment is between 0.554 and 0.559, based on 228 observations. Since the dependent variable is dichotomous, the probability of a survivor experiencing increased stress symptoms in the post-election period is almost certain.

I'm not sure how to interpret that passage: Is the 95% confidence interval that thin (0.554, 0.559) based on 228 observations? Is the mean estimate of about 0.554 to 0.559 being interpreted as almost certain? Here is the paragraph that that passage is from.

---

Hansen and Dolan 2022

Political Behavior published Hansen and Dolan 2022 "Cross‑pressures on political attitudes: Gender, party, and the #MeToo movement in the United States".

Table 1 of Hansen and Dolan 2022 reported results from a regression limited to 694 Republican respondents in a 2018 ANES survey, which indicated that the predicted feeling thermometer rating about the #MeToo movement was 5.44 units higher among women than among men, net of controls, with a corresponding standard error of 2.31 and a statistical significance asterisk. However, Hansen and Dolan 2022 interpreted this to not provide sufficient evidence of a gender gap:

In 2018, we see evidence that women Democrats are more supportive of #MeToo than their male co-partisans. However, there was no significant gender gap among Republicans, which could signal that both women and men Republican identifiers were moved to stand with their party on this issue in the aftermath of the Kavanaugh hearings.

Hansen and Dolan 2022 indicated that this inference of no significant gender gap is because, in Figure 1, the relevant 95% confidence interval for Republican men overlapped with the corresponding 95% confidence interval for Republican women.

Footnote 9 of Hansen and Dolan 2022 noted that assessing statistical significance using overlap of 95% confidence intervals is a "more rigorous standard" than using a p-value threshold of p=0.05 in a regression model. But Footnote 9 also claimed that "Research suggests that using non-overlapping 95% confidence intervals is equivalent to using a p < .06 standard in the regression model (Schenker & Gentleman, 2001)", and I don't think that this "p < .06" claim is correct or at least not misleading.

My Stata analysis of the data for Hansen and Dolan 2022 indicated that the p-value for the gender gap among Republicans on this item is p=0.019, which is about what would be expected given data in Table 1 of a t-statistic of 5.44/2.31 and more than 600 degrees of freedom. From what I can tell, the key evidence from Schenker and Gentleman 2001 is Figure 3, which indicates that the probability of a Type 1 error using the overlap method is about equivalent to p=0.06 only when the ratio of the two standard errors is about 20 or higher.

This discrepancy in inferences might have been avoided if 83.4% confidence intervals were more commonly taught and recommended by editors and reviewers, for visualizations in which the key comparison is between two estimates.

---

Footnote 10 of Hansen and Dolan 2022 states:

While Fig. 1 appears to show that Republicans have become more positive towards #MeToo in 2020 when compared to 2018, the confidence bounds overlap when comparing the 2 years.

I'm not sure what that refers to. Figure 1 of Hansen and Dolan 2022 reports estimates for Republican men in 2018, Republican women in 2018, Republican men in 2020, and Republican women in 2020, with point estimates increasing in that order. Neither 95% confidence interval for Republicans in 2020 overlaps with either 95% confidence interval for Republicans in 2018.

---

Other potential errors in Hansen and Dolan 2022:

[1] The code for the 2020 analysis uses V200010a, which is a weight variable for the pre-election survey, even though the key outcome variable (V202183) was on the post-election survey.

[2] Appendix B Table 3 indicates that 47.3% of the 2018 sample was Republican and 35.3% was Democrat, but the sample sizes for the 2018 analysis in Table 1 are 694 for the Republican only analysis and 1001 for the Democrat only analysis.

[3] Hansen and Dolan 2022 refers multiple times to predictions of feeling thermometer ratings as predicted probabilities, and notes for Tables 1 and 2 indicate that the statistical significance asterisk is for "statistical significance at p > 0.05".

---

Conclusion

I sometimes make mistakes, such as misspelling an author's name in a prior post. In 2017, I preregistered an analysis that used overlap of 95% confidence intervals to assess evidence for the difference between estimates, instead of a preferable direct test for a difference. So some of the flaws discussed above are understandable. But I'm not sure why all of these flaws got past review at respectable journals.

Some of the flaws discussed above are, I think, substantial, such as the political bias in Feinberg et al 2022 not reporting a parallel analysis for Hillary Clinton rallies, especially with the Trump rally result being prominent enough to get a fact check from PolitiFact in 2019. Some of the flaws discussed above are trivial, such as "p < .000". But even trivial flaws might justifiably be interpreted as reflecting a review process that is less rigorous than it should be.

---

I think that peer review is valuable at least for its potential to correct errors in analyses and to get researchers to report results that they otherwise wouldn't report, such as a robustness check suggested by a reviewer that undercuts the manuscript's claims. But peer review as currently practiced doesn't seem to do that well enough.

Part of the problem might be that peer review at a lot of political science journals combines [1] assessment of the contribution of the manuscript and [2] assessment of the quality of the analyses, often for manuscripts that are likely to be rejected. Some journals might benefit from having a (or having another) "final boss" who carefully reads conditionally accepted manuscripts only for assessment [2], to catch minor "p < .000" types of flaws, to catch more important "no Clinton rally analysis" types of flaws, and to suggest robustness checks and additional analyses.

But even better might be opening peer review to volunteers, who collectively could plausibly do a better job than a final boss could do alone. I discussed the peer review volunteer idea in this symposium entry. The idea isn't original to me; for example, Meta-Psychology offers open peer review. The modal number of peer review volunteers for a publication might be zero, but there is a good chance that I would have raised the "no Clinton rally analysis" criticism had PS posted a conditionally accepted version of Feinberg et al 2022.

---

Another potentially good idea would be for journals or an organization such as APSA to post at least a small set of generally useful advice, such as reporting results for a test for differences between estimates if the manuscript suggests a difference between estimates. More specific advice could be posted by topic, such as, for count analyses, advice about predicting counts in which the opportunity varies by observation: Lilley and Wheaton 2019 discussed this page, but I think that this page has an explanation that is easier to understand.

---

NOTES

1. It might be debatable whether this is a flaw per se, but Long 2022 "White identity, Donald Trump, and the mobilization of extremism" reported correlational results from a survey experiment but, from what I can tell, didn't indicate whether any outcomes differed by treatment.

2. Data for Hansen and Dolan 2022. Stata code for my analysis:

desc V200010a V202183

svyset [pw=weight]

svy: reg metoo education age Gender race income ideology2 interest media if partyid2=="Republican"

svy: mean metoo if partyid2=="Republican" & women==1

3. The journal Psychological Science is now publishing peer reviews. Peer reviews are also available for the journal Meta-Psychology.

4. Regarding the prior post about Lacina 2022 "Nearly all NFL head coaches are White. What are the odds?", Bethany Lacina discussed that with me on Twitter. I have published an update at that post.

5. I emailed or tweeted to at least some authors of the aforementioned publications discussing the planned comments or indicating at least some of the criticism. I received some feedback from one of the authors, but the author didn't indicate that I had permission to acknowledge the author.

Tagged with: , , , , ,

The Journal of Race, Ethnicity, and Politics published Nelson 2021 "You seem like a great candidate, but…: Race and gender attitudes and the 2020 Democratic primary".

Nelson 2021 is an analysis of racial attitudes and gender attitudes that makes inferences about the effect of "gender attitudes" using measures that ask only about women, without any appreciation of the need to assess whether the effect of gender attitudes about women are offset by the effect of gender attitudes about men.

But Nelson 2021 has another element that I thought worth blogging about. From pages 656 and 657:

Importantly, though, I hypothesized that the respondent's race will be consequential for whether these race and gender attitudes matter—specifically, that I expect it is white respondents who are driving these relationships. To test this hypothesis, I reran all 16 logit models from above with some minor adjustments. First, I replaced the IVs "Black" and "Latina/o/x" with the dichotomous variable "white." This variable is coded 1 for those respondents who identify as white and 0 otherwise. I also added interaction terms between the key variables of interest—hostile sexism, modern sexism, and racial resentment—and "white." These interactions will help assess whether white respondents display different patterns than respondents of color...

This seems like a good research design: if, for instance, the p-value is less than p=0.05 for the "Racial resentment X White" interaction term, then we can infer that, net of controls, racial resentment associated with the outcome among White respondents differently than racial resentment associated with the outcome among respondents of color.

---

But, instead of reporting the p-value for the interaction terms, Nelson 2021 compared the statistical significance for an estimate among White respondents to the statistical significance for the corresponding estimate among respondents of color, such as:

In seven out of eight cases where racial resentment predicts the likelihood of choosing Biden or Harris, the average marginal effect for white respondents is statistically significant. In those same seven cases, the average marginal effect for respondents of color on the likelihood of choosing Biden or Harris is insignificant...

But the problem with comparing statistical significance for estimates is that a difference in statistical significance doesn't permit an inference that the estimates differ.

For example, Nelson 2021 Table A5 indicates that, for the association of racial resentment and the outcome of Kamala Harris's perceived electability, the 95% confidence interval among White respondents is [-.01, -.001]; this 95% confidence interval doesn't include zero, so that's a statistically significant estimate. The corresponding 95% confidence interval among respondents of color is [-.01, .002]; this 95% confidence interval includes zero, so that's not a statistically significant estimate.

But the corresponding point estimates are reported as -0.01 among White respondents and -0.01 among respondents of color, so there doesn't seem to be sufficient evidence to claim that these estimates differ from each other. Nonetheless, Nelson 2021 counts this as one of the seven cases referenced in the aforementioned passage.

Nelson 2021 Table 1 indicates that the sample had 906 White respondents and 466 respondents of color. The larger sample for Whites than respondents of color biases the analysis toward a better chance of detecting statistical significance among White respondents than among respondents of colors.

---

Table A5 provides sufficient evidence that some interaction terms had a p-value less than p=0.05, such as for the policy outcome for Joe Biden, with non-overlapping 95% confidence intervals for hostile sexism of [-.02, .0004] for respondents of color and [.002, .02] for White respondents.

But I'm not sure how much this matters, without evidence about how well hostile sexism measured gender attitudes among White respondents, compared to how well hostile sexism measured gender attitudes among respondents of color.

Tagged with: , ,

PLOS ONE recently published Gillooly et al 2021 "Having female role models correlates with PhD students' attitudes toward their own academic success".

Colleen Flaherty at Inside Higher Ed quoted Gillooly et al 2021 co-author Amy Erica Smith discussing results from the article. From the Flaherty story, with "she" being Amy Erica Smith:

"When we showed students a syllabus with a low percentage of women authors, men expressed greater confidence than women in their ability to do well in the class" she said. "When we showed students syllabi with more equal gender representation, men's self-confidence declined, but women and men still expressed equal confidence in their ability to do well. So making the curriculum more fair doesn't actually hurt men relative to women."

Figure 1 of Gillooly et al 2021 presented evidence of this male student backlash, with the figure note indicating that the analysis controlled for "orientations toward quantitative and qualitative methods". Gillooly et al 2021 indicated that these "orientation" measures incorporate respondent ratings of their interest and ability in quantitative methods and qualitative methods.

But the "Grad_Experiences_Final Qualtrics Survey" file indicates that these "orientation" measures appeared on the survey after respondents received the treatment. And controlling for such post-treatment "orientation" measures is a bad idea, as discussed in Montgomery et al 2018 "How Conditioning on Posttreatment Variables Can Ruin Your Experiment and What to Do about It".

The "orientation" items were located on the same Qualtrics block as the treatment and the self-confidence/self-efficacy item, so it seems possible that these "orientation" items might have been intended as outcomes and not as controls. I didn't find any preregistration that indicates the Gillooly et al plan for the analysis.

---

I used the Gillooly et al 2021 data to assess whether there is sufficient evidence that this "male backlash" effect occurs in straightforward analyses that omit the post-treatment controls. The p-value is about p=0.20 for the command...

ologit q14recode treatment2 if female==0, robust

...which tests the null hypothesis that male students' course-related self-confidence/self-efficacy as measured on the five-point scale did not differ by the difference in percentage of women authors on the syllabus.

See the output file below for more analysis. For what it's worth, the data provided sufficient evidence at p<0.05 that, among men students, the treatment affected responses to three of the four items that Gillooly et al 2021 used to construct the "orientation" controls.

---

NOTES

1. Data. Stata code. Output file.

2. Prior post discussing a biased benchmark in research by two of the Gillooly et al 2021 co-authors.

3. Figure 1 of Gillooly et al 2021 reports 76% confidence intervals to help assess a p<0.10 difference between estimates, and Figure 2 of Gillooly et al 2021 reports 84% confidence intervals to help assess a p<0.05 difference between estimates. I would be amazed if this p=0.05 / p=0.10 variation was planned before Gillooly et al analyzed the data.

Tagged with: , , , ,

PS: Political Science & Politics published Utych 2020 "Powerless Conservatives or Powerless Findings?", which responded to arguments in my 2019 "Left Unchecked" PS symposium entry. From Utych 2020:

Zigerell (2019) presented arguments that research supporting a conservative ideology is less likely to be published than research supporting a liberal ideology, focusing on the most serious accusations of ideological bias and research malfeasance. This article considers another less sinister explanation—that research about issues such as anti-man bias may not be published because it is difficult to show conclusive evidence that it exists or has an effect on the political world.

I wasn't aware of the Utych 2020 PS article until I saw a tweet that it was published, but the PS editors kindly permitted me to publish a reply, which discussed evidence that anti-man bias exists and has an effect on the political world.

---

One of the pieces of evidence for anti-man bias mentioned in my PS reply was the Schwarz and Coppock meta-analysis of candidate choice experiments involving male candidates and female candidates. This meta-analysis was accepted at the Journal of Politics, and Steve Utych indicated on Twitter that it was a "great article" and that he was a reviewer of the article. The meta-analysis detected a bias favoring female candidates over male candidates, so I asked Steve Utych whether it is reasonable to characterize the results from the meta-analysis as reasonably good evidence that anti-man bias exists and has an effect in the political realm.

I thought that the exchange that I had with Steve Utych was worth saving (archived: https://archive.is/xFQvh). According to Steve Utych, this great meta-analysis of candidate choice experiments "doesn't present information about discrimination or biases". In the thread, Steve Utych wouldn't describe what he would accept as evidence of anti-man bias in the political realm, but he was willing to equate anti-man bias with alien abduction.

---

Suzanne Schwarz, who is the lead author of the Schwarz and Coppock meta-analysis, issued a series of tweets (archived: https://archive.is/pFSJ0). The thread was locked before I could respond, so I thought that I would blog about my comments on her points, which she labeled "first" through "third".

Her first point, about majority preference, doesn't seem to be relevant about whether anti-man bias exists and has an effect in the political realm.

For her second point, that voting in candidate choice experiments might differ from voting in real elections, I think that it's within reason to dismiss results from survey experiments, and I think that it's within reason to interpret results from survey experiments as offering evidence about the real world. But I think that each person should hold no more than one of those positions at a given time.

So if Suzanne Schwarz doesn't think that the meta-analysis provides evidence about voter behavior in real elections, there might still be time for her and her co-author to remove language from their JOP article that suggests that results from the meta-analysis provide evidence about voter behavior in real elections, such as:

Overall, our findings offer evidence against demand-side explanations of the gender gap in politics. Rather than discriminating against women who run for office, voters on average appear to reward women.

And instead of starting the article with "Do voters discriminate against women running for office?", maybe the article could instead start by quoting language from Suzanne Schwarz's tweets. Something such as:

Do "voters support women more in experiments that simulate hypothetical elections with hypothetical candidates"? And should anyone care, given that this "does not necessarily mean that those voters would support female politicians in real elections that involve real candidates and real stakes"?

I think that Suzanne Schwarz's third point is that a person's preference for A relative to B cannot be interpreted as an "anti" bias against B, without information about that person's attitudinal bias, stereotypes, or animus regarding B.

Suzanne Schwarz claimed that we would not interpret a preference for orange packaging over green packaging as evidence of an "anti-green" bias, but let's use a hypothetical involving people, of an employer who always hires White applicants over equally qualified Black applicants. I think that it would be at least as reasonable to describe that employer as having an anti-Black bias, compared to applying the Schwarz and Coppock language quoted above, to describe that employer as "appear[ing] to reward" White applicants.

---

The Schwarz and Coppock meta-analysis of 67 survey experiments seems like it took a lot of work, was published in one of the top political science journals, and, according to its abstract, was based on an experimental methodology that "[has] become a standard part of the political science toolkit for understanding the effects of candidate characteristics on vote choice", with results that add to the evidence that "voter preferences are not a major factor explaining the persistently low rates of women in elected office".

So it's interesting to see the "doesn't present information about discrimination or biases" and "does not necessarily mean that those voters would support female politicians in real elections that involve real candidates and real stakes" reactions on Twitter archived above, respectively from a peer reviewer who described the work as "great" and from one of the co-authors.

---

NOTES

1. Zach Goldberg and I have a manuscript presenting evidence that anti-man bias exists and has a political effect, based on participant feeling thermometer ratings about men and about women in data from the 2019 wave of the Democracy Fund Voter Study Group VOTER survey. Zach tweeted about a prior version of the manuscript. The idea for the manuscript goes back at least to a Twitter exchange from March 2020 (Zach, me).

Steve Utych reported on the 2019 wave of this VOTER survey in his 2021 Electoral Studies article about sexism against women, but neither his 2021 Electoral Studies article or his PS article questioning the idea of anti-man bias reported results from the feeling thermometer ratings about men and about women.

Tagged with: ,