Guest post at Political Science Replication
Here.
Here is the title and abstract to my 2015 MPSA proposal:
A Troublesome Belief? Social Inequality and Belief in Human Biological Differences
In A Troublesome Inheritance, Nicholas Wade speculated that biological differences might help explain inequality of outcomes between human groups. Reviewers suggested that Wade's speculations might encourage xenophobia, so, to understand the possible attitudinal consequences of such a belief, I develop predictions based on the expectation that belief in a biological explanation for group-level social inequalities reduces the perceived need for policies to reduce these inequalities. General Social Survey data supported predictions that this belief is correlated with lower support for policies to reduce sexual inequalities, support for greater social distance between racial groups, more support for traditional sex roles, and less support for immigration, but did not indicate a correlation with aggregate support for policies to reduce racial inequalities. I further developed and tested predictions regarding the possibility that persons who perceive biological differences to have resulted from unguided processes such as Darwinian evolution adopt more progressive attitudes toward social inequalities than persons who perceive biological differences to have resulted from guided processes such as intelligent design.
---
UPDATE (Nov 5, 2014)
The "Troublesome Belief" proposal was accepted for the MPSA public opinion panel, "Using public opinion to gauge democracy and the good life."
---
UPDATE (Mar 10, 2015)
Draft of the manuscript for the MPSA presentation is here. Data are here. Code is here.
---
UPDATE (Mar 23, 2015)
Updated draft of the manuscript for the MPSA presentation is here. Data are here. Code is here. Thanks to Emil Ole William Kirkegaard for helpful comments.
---
UPDATE (Feb 13, 2016)
Updated draft of the manuscript is here.
Here's the abstract of a PLoS One article, "Racial Bias in Perceptions of Others' Pain":
The present work provides evidence that people assume a priori that Blacks feel less pain than do Whites. It also demonstrates that this bias is rooted in perceptions of status and the privilege (or hardship) status confers, not race per se. Archival data from the National Football League injury reports reveal that, relative to injured White players, injured Black players are deemed more likely to play in a subsequent game, possibly because people assume they feel less pain. Experiments 1–4 show that White and Black Americans–including registered nurses and nursing students–assume that Black people feel less pain than do White people. Finally, Experiments 5 and 6 provide evidence that this bias is rooted in perceptions of status, not race per se. Taken together, these data have important implications for understanding race-related biases and healthcare disparities.
Here are descriptions of the samples for each experiment, after exclusions of respondents who did not meet criteria for inclusion:
Not the most representative samples, of course. If you're thinking that it would be interesting to see whether results hold in a nationally representative sample with a large sample size, well, that was tried, with a survey experiment as part of the Time Sharing Experiments in the Social Sciences. Here's the description of the results listed on the TESS site for the study:
Analyses yielded mixed evidence. Planned comparison were often marginal or non-significant. As predicted, White participants made (marginally) lower pain ratings for Black vs. White targets, but only when self-ratings came before target ratings. When target ratings came before self-ratings, White participants made (marginally) lower pain ratings for White vs. Black targets. Follow-up analyses suggest that White participants may have been reactant. White participants reported that they were most similar to the Black target and least similar to the White target, contrary to prediction and previous work both in our lab and others' lab. Moreover, White participants reported that Blacks were most privileged and White participants least privileged, again contrary to prediction and previous work both in our lab and others' lab.
The results of this TESS study do not invalidate the results of the six experiments and one archival study reported in the PLoS One article, but the non-reporting of the TESS study does raise questions about whether there were other unreported experiments and archival studies.
The TESS study had an unusually large and diverse sample: 586 non-Hispanic whites, 526 non-Hispanic blacks, 520 non-Hispanic Asians, and 528 Hispanics. It's too bad that these data were placed into a file drawer.
Here are some graphs to follow up on this Monkey Cage post.

 ---
---
UPDATE (Sept 12, 2014)
Here's another graph of the Bailey data, to illustrate the narrowing and moderate cross-time shift of the congressional GOP and northern Democratic ideal point estimates, but a more dramatic leftward cross-time shift in the congressional southern Democratic ideal point estimates.

---
UPDATE (Sept 13, 2014)
Here are the do files I used to create a database with Bailey scores and state and party codes for each case (House, Senate). Here is a description of the process that I used to create the do files.
I blogged here about inferential problems in the typical symbolic racism research study, which measures symbolic racism with these items:
1. Irish, Italians, Jewish and many other minorities overcame prejudice and worked their way up. Blacks should do the same without any special favors.
2. Generations of slavery and discrimination have created conditions that make it difficult for blacks to work their way out of the lower class.
3. Over the past few years, blacks have gotten less than they deserve.
4. It's really a matter of some people not trying hard enough; if blacks would only try harder they could be just as well off as whites.
One inferential problem is that the above items cannot differentiate racial bias from non-racial beliefs and attitudes; for example, a respondent might oppose special favors for blacks because that respondent is racist or because that respondent opposes special favors in general.
Symbolic racism research has typically addressed this inferential problem through statistical control, tossing into a regression such variables as partisanship, self-identified ideology, or specific conservative beliefs. But the working manuscript here provided evidence that statistical control does not always isolate the racial component of symbolic racism.
The TESS proposal that I recently submitted tried to isolate the racial component of symbolic racism through a survey experiment: a randomly-selected half of white respondents would receive the traditional symbolic racism items, and the other half would receive an adjusted set of items, such as "Irish, Italians, Jewish and many other groups overcame prejudice and worked their way up. Poor whites should do the same without any special favors." The idea would be to compare support for the traditional item to support for the adjusted item to assess how much responses differ due to the target mentioned in the item (blacks or poor whites).
I did not originate this idea: Paul Sniderman and Edward Carmines reported a survey that did the same exact thing, but which used "new immigrants from Europe" in the special favors item (see p. 199 here, but the survey is reported in other publications, too). However, as far as I can tell, that survey experiment concerned only the special favors symbolic racism item; the purpose of the proposed experiment is to assess the racial component of the entire battery of symbolic racism items.
Benefits of the survey experiment measurement of symbolic racism are resources saved (no need to include control items) and stronger inference. Ideally, adjusted items could reflect the race or ethnicity of each respondent, such as poor Hispanics or poor Asians instead of poor whites.
Here is the proposal for TESS, which was rejected. Comments are welcome.
Christopher D. DeSante published an article in the American Journal of Political Science titled, "Working Twice as Hard to Get Half as Far: Race, Work Ethic, and America’s Deserving Poor" (57: 342-356, April 2013). The title refers to survey evidence that DeSante reported indicating that, compared to hypothetical white applicants for state assistance, hypothetical black applicants for state assistance received less reward for hard work and more punishment for laziness.
The study had a clever research design: respondents were shown two applications for state assistance, and each applicant was said to need $900, but there was variation in the names of the applicants (Emily, Laurie, Keisha, Latoya, or no name provided) and in the Worker Quality Assessment of the applicant (poor, excellent, or no assessment section provided); respondents were then asked to divide $1500 between the applicants or to use some or all of the $1500 to offset the state budget deficit.
Table 1 below indicates the characteristics of the conditions and the mean allocations made to each alternative. In condition 5, for example, 64 respondents were asked to divide $1500 between hardworking Laurie, lazy Emily, and offsetting the state budget deficit: hardworking Laurie received a mean allocation of $682, lazy Emily received a mean allocation of $566, and the mean allocation to offset the state budget deficit was $250.

---
I'm going to quote DeSante (2013: 343) and intersperse comments about the claims. For the purpose of this analysis, let's presume that respondents interpreted Emily and Laurie as white applicants and Keisha and Latoya as black applicants. Reported p-values for my analysis below are two-tailed p-values. Here's the first part of our DeSante (2013: 343) quote.
Through a nationally representative survey experiment in which respondents were asked to make recommendations regarding who should receive government assistance, I find that American “principles” of individualism, hard work, and equal treatment serve to uniquely benefit whites in two distinct ways. First, the results show that compared to African Americans, whites are not automatically perceived as more deserving of government assistance.
Condition 7 paired Laurie with Keisha, neither of whom had a Worker Quality Assessment. Laurie received a mean allocation of $556, and Keisha received a mean allocation of $600. Keisha received $44 more than Laurie, a $44 difference that is statistically significant at p<0.01. So DeSante is technically correct that "whites are not automatically perceived as more deserving of government assistance," but this claim overlooks evidence from condition 7 that a white applicant was given LESS government assistance than an equivalent black applicant.
Instead of reporting these straightforward results from condition 7, how did DeSante compare allocations to black and white applicants? Below is an image from Table 2 of DeSante (2013), which reported results from eleven t-tests. Tests 3 and 4 provided the evidence for DeSante's claim that, "compared to African Americans, whites are not automatically perceived as more deserving of government assistance."

Here's what DeSante did in test 3: DeSante took the $556 allocated to Laurie in condition 7 when Laurie was paired with Keisha and compared that to the $546 allocated to Latoya in condition 10 when Latoya was paired with Keisha; that $9 advantage (bear with the rounding error) for Laurie over Latoya (when both applicants were paired with Keisha and neither had a Worker Quality Assessment) did not reach conventional levels of statistical significance.
Here's what DeSante did in test 4: DeSante took the $587 allocated to Emily in condition 4 when Emily was paired with Laurie and compared that to the $600 allocated to Keisha in condition 7 when Keisha was paired with Laurie; that $12 advantage for Keisha over Emily (when both applicants were paired with Laurie and neither had a Worker Quality Assessment) did not reach conventional levels of statistical significance.
So which of these three tests is the best test? My test had more observations, compared within instead of across conditions, and had a lower standard error. But DeSante's tests are not wrong or meaningless: the problem is that tests 3 and 4 provide incomplete information for the purposes of testing for racial bias against applicants with no reported Worker Quality Assessment.
---
Here's the next part of that quote from DeSante (2013: 343):
Instead, the way hard work and "laziness" are treated is conditioned by race: whites gain more for the same level of effort, and blacks are punished more severely for the same level of "laziness."
Here's what DeSante did to produce this inference. Emily received a mean allocation of $587 in condition 4 when paired with Laurie and neither applicant had a Worker Quality Assessment; but hard-working Emily received $711 in condition 6 when paired with lazy Laurie. This $123 difference can be interpreted as a reward for Emily's hard work, at least in relation to Laurie's laziness.
Now we do the same thing for Keisha paired with Laurie: Keisha received a mean allocation of $600 in condition 7 when paired with Laurie and neither applicant had a Worker Quality Assessment; but hard-working Keisha received $607 in condition 9 when paired with lazy Laurie. This $7 difference can be interpreted as a reward for Keisha's hard work, at least in relation to Laurie's laziness.
Test 7 indicates that the $123 reward to Emily for her hard work was larger than the $7 reward to Keisha for her hard work (p=0.03).
But notice that DeSante could have conducted another set of comparisons:
Laurie received a mean allocation of $556 in condition 7 when paired with Keisha and neither applicant had a Worker Quality Assessment; but hard-working Laurie received $620 in condition 8 when paired with lazy Keisha. This $64 difference can be interpreted as a reward for Laurie's hard work, at least in relation to Keisha's laziness.
Now we do the same thing for Latoya paired with Keisha: Latoya received a mean allocation of $546 in condition 10 when paired with Keisha and neither applicant had a Worker Quality Assessment; but hard-working Latoya received $627 in condition 11 when paired with lazy Keisha. This $81 difference can be interpreted as a reward for Latoya's hard work, at least in relation to Keisha's laziness.
The $16 difference between Laurie's $64 reward for hard work and Latoya's $81 reward for hard work (rounding error, again) is not statistically significant at conventional levels (p=0.76). The combined effect of the DeSante test and my alternate test is not statistically significant at conventional levels (effect of $49, p=0.20), so -- in this dataset -- there is a lack of evidence at a statistically significant level for the claim that "whites gain more for the same level of effort."
I conducted a similar set of alternate tests for the inference that "blacks are punished more severely for the same level of "laziness"; the effect size was smaller in my test compared to DeSante's test, but evidence for the the combined effect was believable: a $74 effect, with p=0.06.
---
Here's the next part of that quote from DeSante (2013: 343):
Second, and consistent with those who take the "principled ideology" approach to the new racism measures, the racial resentment scale is shown to predict a desire for smaller government and less government spending. However, in direct opposition to this ideology-based argument, this effect is conditional upon the race of the persons placing demands on the government: the effect of racial resentment on a desire for a smaller government greatly wanes when the beneficiaries of that government spending are white as opposed to black. This represents strong evidence that racial resentment is more racial animus than ideology.
DeSante based this inference on results reported in Table 3, reproduced below:

Notice the note at the bottom: "White respondents only." DeSante reported results in Table 3 based on responses only from respondents coded as white, but reported results in Table 2 based on responses from respondents coded as white, black, Asian, Native American, mixed race, or Other. Maybe there's a good theoretical reason for changing the sample. DeSante's data and code are posted here if you are interested in what happens to p-values when Table 2 results are restricted to whites and Table 3 results include all respondents.
But let's focus on the bold RRxWW line in Table 3. RR is racial resentment, and WW is a dichotomous variable for the conditions in which both applicants were white. Model 3 includes categories for WW (two white applicants paired together), BB (two black applicants paired together), and WB (one white applicant paired with one black applicant); this is very important, because these included terms must be interpreted in relation to the omitted category that I will call NN (two unnamed applicants paired together). Therefore, the -337.92 coefficient on the RRxWW variable in model 3 indicates that -- all other model variables held constant -- white respondents allocated $337.92 less to offset the state budget deficit when both applicants were white compared to when both applicants were unnamed.
The -196.43 coefficient for the RRxBB variable in model 3 indicates that -- all other model variables held constant -- white respondents allocated $196.43 less to offset the state budget deficit when both applicants were black compared to when both applicants were unnamed. This -$196.43 coefficient did not reach statistical significance, but the coefficient is important because the bias in favor of the two white applicants relative to the two black applicants is only -$337.92 minus -$196.43; so whites allocated $141.49 less to offset the state budget deficit when both applicants were white compared to when both applicants were black, but the p-value for this difference was 0.41.
---
Here's a few takeaways from the above analysis:
1. The limited choice of statistical tests reported in DeSante (2013) produced inferences that overestimated the extent of bias against black applicants and missed evidence of bias against white applicants.
2. Takeaway 1 depends on the names reflecting only race of the applicant. But the names might have reflected something other than race; for instance, in condition 10, Keisha received a mean allocation $21 higher than the mean allocation to Latoya (p=0.03): such a difference is not expected if Keisha and Latoya were "all else equal."
3. Takeaway 1 would likely not have been uncovered had the AJPS not required the posting of data and replication files from its published articles.
4. Pre-registration would eliminate suspicion about research design decisions, such as decisions to restrict only some analyses to whites and to report some comparisons but not others.
---
In case you are interested in reproducing the results that I discussed, the data are here, code is here, and the working paper is here. Comments are welcome.
---
UPDATE (Nov 2, 2014)
I recently received a rejection for the manuscript describing the results reported above; the second reviewer suggested portraying the raw data table as a graph: I couldn't figure out an efficient way to do that, but the suggestion did get me to realize a good way to present the main point of the manuscript more clearly with visuals.
The figure below illustrates the pattern of comparison for DeSante 2013 tests 1 and 2: solid lines represent comparisons reported in DeSante 2013 and dashed lines represent unreported equivalent or relevant comparisons; numbers in square brackets respectively indicate the applicant and the condition, so that [1/2] indicates applicant 1 in condition 2.

---
The figure below indicates the pattern of reported and unreported comparisons for black applicants and white applicants with no Worker Quality Assessment: the article reported two small non-statistically significant differences when comparing applicants across conditions, but the article did not report the larger statistically significant difference favoring the black applicant when a black applicant and a white applicant were compared within conditions.
 ---
---
The figure below indicates the pattern of reported and unreported comparisons for the main takeaway of the article. The left side of the figure indicates that one of the black applicants received a lesser reward for an excellent Worker Quality Assessment and received a larger penalty for a poor Worker Quality Assessment, compared to the reward and penalty for the corresponding white applicant; however, neither the lesser reward for an excellent Worker Quality Assessment nor the larger penalty for a poor Worker Quality Assessment was present at a statistically significant level in the comparisons on the right, which were not reported in the article (p=0.76 and 0.31, respectively).
 ---
---
Data for the reproduction are here. Reproduction code is here.
---
UPDATE (Mar 8, 2015)
The above analysis has been published here by Research & Politics.
Rattan et al. (2012) reported evidence, as indicated in the abstract, that:
...simply bringing to mind a Black (vs. White) juvenile offender led participants to view juveniles in general as significantly more similar to adults in their inherent culpability and to express more support for severe sentencing.
Data for the study were collected by the Time Sharing Experiments for the Social Sciences and are located here.*
In this post, I present results of an attempt to reproduce and extend this study.
---
The first takeaway is substantive: the reproduction and extension suggest that Rattan et al. might have applied the incorrect theory to explain results because their reported analyses were limited to white respondents.
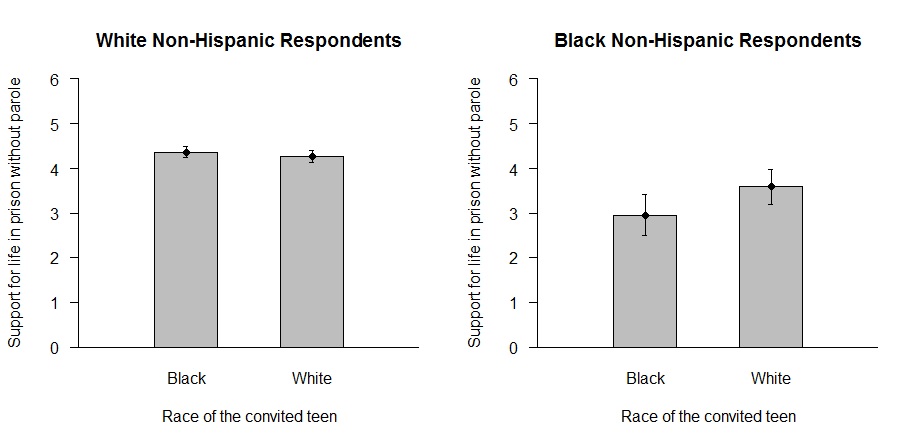
Here's part of a figure from Rattan et al. (2012):

The figure indicates that white respondents in the study expressed more support for life in prison without parole when primed to think about a black juvenile offender than when primed to think about a white juvenile offender. The authors appear to attribute this racial bias to stereotypic associations:
The results also extend the established literature in social psychology examining the cognitive association between the social category "Black" and criminality, and raise the possibility that this race-crime association may be at odds with lay people’s typical notions about the innocence of juveniles. [citation removed]
But here are the results when observations from both white and black respondents are reported:

Blacks offered more support for life in prison without parole when primed to think of a white juvenile offender than when primed to think of a black juvenile offender. If there is a generalized effect here, it does not appear that the effect is caused by stereotypic associations of criminality with the social category "black." It seems more likely that the racial bias detected in the study reflected ingroup favoritism or outgroup antagonism among both whites and blacks.
Check out the working paper here for more detail on the results, a more nuanced breakdown of white responses, background on related research, and policy implications; feel free to comment on this blog post or to email comments regarding the working paper.
---
The second takeaway is methodological: the reproduction and extension suggest that this study seems to suffer from researcher degrees of freedom.
One of the first things that I noticed when comparing the article to the data was that the article mentioned two dependent variables but there appeared to be four dependent variables in the survey; based on my analyses, the two dependent variables not mentioned in the study did not appear to provide evidence of racial bias. I suppose that I can understand the idea that these null findings reflect "failed" experiments in some way, but I'd have liked as a reader to have been informed that racial bias was detected for only half of the dependent variables.
I also noticed that the dataset had three manipulation check items, but only one of these manipulation checks was used in the analysis; of course, the manipulation check that was used was the most important manipulation check (remembering the race of the juvenile offender), but I'd have liked as a reader to have been informed that manipulation checks for the juvenile offender's age and crime were unused.
And I noticed -- and this is more a problem with SPSS and statistics training than with the Rattan et al. analysis -- that the weighting of observations in SPSS resulted in incorrectly deflated p-values. I discussed this problem here and here and here; data for the first link were the Rattan et al. (2012) data.
---
* There are two datasets for the Rattan et al. (2012) study. I received the full dataset in an email from TESS, and this dataset was previously posted at the TESS archive; the dataset currently posted at the TESS archive contains a weight2 variable for only white respondents who met participation criteria, provided complete data, and finished the survey in one minute or longer.
---
UPDATE (Mar 15, 2015)
Replaced the figure with results for white and black respondents, which should have ranged from 1 to 6. The original figure incorrectly ranged from 0 to 6.