Andrew Gelman linked to a story (see also here) about a Science article by Annie Franco, Neil Malhotra, and Gabor Simonovits on the file drawer problem in the Time Sharing Experiments for the Social Sciences. TESS fields social science survey experiments, and sometimes the results of these experiments are not published.
I have been writing up some of these unpublished results but haven't submitted anything yet. Neil Malhotra was kind enough to indicate that I'm not stepping on their toes, so I'll post what I have so far for comment. From what I have been able to determine, none of these studies discussed below were published, but let me know if I am incorrect about that. I'll try to post a more detailed write-up of these results soon, but in the meantime feel free to contact me for details on the analyses.
I've been concentrating on bias studies, because I figure that it's important to know if there is little-to-no evidence of bias in a large-scale nationally-representative sample; not that such a study proves that there's no bias, but reporting these studies helps to provide a better estimate for the magnitude of bias. It's also important to report evidence of bias in unexpected directions.
TESS 241
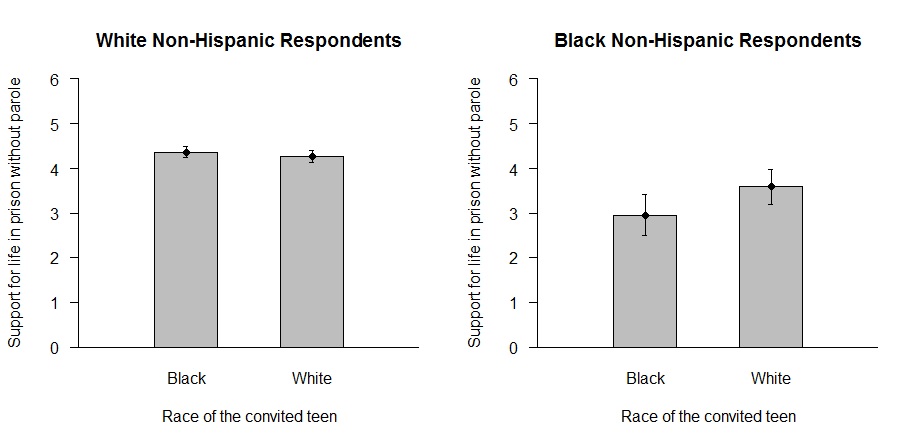
TESS study 241, based on a proposal from Stephen W. Benard, tested for race and sex bias in worker productivity ratings. Respondents received a vignette about the work behavior of a lawyer whose name was manipulated in the experimental conditions to signal the lawyer's sex and race: Kareem (black male), Brad (white male), Tamika (black female), and Kristen (white female). Respondents were asked how productive the lawyer was, how valuable the lawyer was, how hardworking the lawyer was, how competent the lawyer was, whether the lawyer deserved a raise, how respected the lawyer was, how honorable the lawyer was, how prestigious the lawyer was, how capable the lawyer was, how intelligent the lawyer was, and how knowledgeable the lawyer was.
Substantive responses to these eleven items were used to create a rating scale, with items standardized before summing and cases retained if there were substantive responses for at least three items; this scale had a Cronbach's alpha of 0.92. The scale was standardized so that its mean and standard deviation were respectively 0 and 1; higher values on the scale indicate more favorable evaluations.
Here is a chart of the main results, with experimental targets on the left side:
 The figure indicates point estimates and 95% confidence intervals for the mean level of evaluations in experimental conditions for all respondents and disaggregated groups; data were not weighted because the dataset did not contain a post-stratification weight variable.
The bias in this study is against Brad relative to Kareem, Kristen, and Tamika.
TESS 392
TESS study 392, based on a proposal from Lisa Rashotte and Murray Webster, tested for bias based on sex and age. Respondents were randomly assigned to receive a picture and text description of one of four target persons: Diane Williams, a 21-year-old woman; David Williams, a 21-year-old man; Diane Williams, a 45-year-old woman; and David Williams, a 45-year-old man. Respondents were asked to rate the target person on nine traits, drawn from Webster and Driskell (1983): intelligence, ability in situations in general, ability in things that the respondent thinks counts, capability at most tasks, reading ability, abstract abilities, high school grade point average, how well the person probably did on the Federal Aviation Administration exam for a private pilot license, and physical attractiveness. For the tenth item, respondents were shown their ratings for the previous nine items and given an opportunity to change their ratings.
The physical attractiveness item was used as a control variable in the analysis. Substantive responses to the other eight items were used to create a rating scale, with items standardized before summing and cases retained if the case had substantive responses for at least five items; this scale had a Cronbach's alpha of 0.91. The scale was standardized so that its mean and standard deviation were respectively 0 and 1; higher values on the scale indicate more favorable evaluations.
Here is a chart of the main results, with experimental targets on the left side:
 The figure indicates point estimates and 95% confidence intervals for the mean level of evaluations in experimental conditions for all respondents and disaggregated groups; data were weighted. The bias in this study, among women, is in favor of older persons and, among men, is in favor of the older woman. Here's a table of 95% confidence intervals for mean rating differences for each comparison:

TESS 012
TESS study 012, based on a proposal from Emily Shafer, tested for bias for or against married women based on the women's choice of last name after marriage. The study's six conditions manipulated a married woman's last name and the commitment that caused the woman to increase the burden on others. Conditions 1 and 4, 2 and 5, and 3 and 6 respectively reflected the woman keeping her last name, hyphenating her last name, or adopting her husband's last name; the vignette for conditions 1, 2, and 3 indicated that the woman's co-workers were burdened because of the woman's marital commitment, and the vignette for conditions 4, 5, and 6 indicated that the woman's husband was burdened because of the woman's work commitment.
Substantive responses to items 1, 2, 5A, and 6A were used to create an "employee evaluation" scale, with items standardized before summing and cases retained if there were substantive responses for at least three items; this scale had a Cronbach's alpha of 0.73. Substantive responses to items 3, 4, 5B, and 6B were used to create a "wife evaluation" scale, with items standardized before summing and cases retained if there were substantive responses for at least three items; this scale had a Cronbach's alpha of 0.74. Both scales were standardized so that their mean and standard deviation were respectively 0 and 1 and then reversed so that higher scores indicated a more positive evaluation.
Results are presented for the entire sample, for men, for women, for persons who indicated that they were currently married or once married and used traditional last name patterns (traditional respondents), and for persons who indicated that they were currently married or once married but did not use traditional last name patterns (non-traditional respondents); name patterns were considered traditional for female respondents who changed their last name to their spouse's last name (with no last name change by the spouse), and male respondents whose spouse changed their last name (with no respondent last name change).
Here is a chart of the main results, with experimental conditions on the left side:

The figure displays point estimates and 95% confidence intervals for weighted mean ratings for each condition, adjusted for physical attractiveness. Not much bias detected here, except for men's wife evaluations when the target woman kept her last name.
TESS 714
TESS study 714, based on a proposal from Kimberly Rios Morrison, tested whether asking whites to report their race as white had a different effect on multiculturalism attitudes and prejudice than asking whites to report their ethnicity as European American. See here for published research on this topic.
Respondents were randomly assigned to one of three groups: respondents in the European American prime group were asked to identify their race/ethnicity as European American, American Indian or Alaska Native, Asian American or Pacific Islander, Black or African American, Hispanic/Latino, or Other; respondents in the White prime group were asked to identify their race/ethnicity from the same list but with European American replaced with White; and respondents in the control group were not asked to identify their race/ethnicity.
Respondents were shown 15 items regarding ethnic minorities, divided into four sections that we'll call support for multiculturalism, support for pro-ethnic policies, resentment of ethnic minorities, and closeness to whites. Scales were made for items from the first three sections; to create a "closeness to whites" scale, responses to the item on closeness to ethnic minorities were subtracted from responses to the item on closeness to nonminorities, to indicate degree of closeness to whites; this item was then standardized.
Here is a chart of the main results, with experimental conditions on the left side:
 The figure displays weighted point estimates and 95% confidence intervals. The prime did not have much influence, except for the bottom right graph.
---
There's a LOT of interesting things in the TESS archives. Comparing reported results to my own analyses of the data (not for the above studies, but for other studies) has illustrated the inferential variation that researcher degrees of freedom can foster.
One of the ways to assess claims of liberal bias in social science is to comb through data such as the TESS archives, which let us see what a sample of researchers are interested in and what a sample of researchers place into their file drawer. Researchers placing null results into a file drawer is ambiguous because we cannot be sure whether placement in the file drawer is due to the null results or to the political valence of the null results; however, researchers placing statistically significant results into a file drawer has much less ambiguity.
---
UPDATE (Sept 6, 2014)
Gábor Simonovits, one of the co-authors of the Science article, quickly and kindly sent me a Stata file of their dataset; that data and personal communication with Stephen W. Benard indicated that results from none of the four studies reported in this post have been published.


