Guest post at Political Science Replication
Here.
Christopher D. DeSante published an article in the American Journal of Political Science titled, "Working Twice as Hard to Get Half as Far: Race, Work Ethic, and America’s Deserving Poor" (57: 342-356, April 2013). The title refers to survey evidence that DeSante reported indicating that, compared to hypothetical white applicants for state assistance, hypothetical black applicants for state assistance received less reward for hard work and more punishment for laziness.
The study had a clever research design: respondents were shown two applications for state assistance, and each applicant was said to need $900, but there was variation in the names of the applicants (Emily, Laurie, Keisha, Latoya, or no name provided) and in the Worker Quality Assessment of the applicant (poor, excellent, or no assessment section provided); respondents were then asked to divide $1500 between the applicants or to use some or all of the $1500 to offset the state budget deficit.
Table 1 below indicates the characteristics of the conditions and the mean allocations made to each alternative. In condition 5, for example, 64 respondents were asked to divide $1500 between hardworking Laurie, lazy Emily, and offsetting the state budget deficit: hardworking Laurie received a mean allocation of $682, lazy Emily received a mean allocation of $566, and the mean allocation to offset the state budget deficit was $250.

---
I'm going to quote DeSante (2013: 343) and intersperse comments about the claims. For the purpose of this analysis, let's presume that respondents interpreted Emily and Laurie as white applicants and Keisha and Latoya as black applicants. Reported p-values for my analysis below are two-tailed p-values. Here's the first part of our DeSante (2013: 343) quote.
Through a nationally representative survey experiment in which respondents were asked to make recommendations regarding who should receive government assistance, I find that American “principles” of individualism, hard work, and equal treatment serve to uniquely benefit whites in two distinct ways. First, the results show that compared to African Americans, whites are not automatically perceived as more deserving of government assistance.
Condition 7 paired Laurie with Keisha, neither of whom had a Worker Quality Assessment. Laurie received a mean allocation of $556, and Keisha received a mean allocation of $600. Keisha received $44 more than Laurie, a $44 difference that is statistically significant at p<0.01. So DeSante is technically correct that "whites are not automatically perceived as more deserving of government assistance," but this claim overlooks evidence from condition 7 that a white applicant was given LESS government assistance than an equivalent black applicant.
Instead of reporting these straightforward results from condition 7, how did DeSante compare allocations to black and white applicants? Below is an image from Table 2 of DeSante (2013), which reported results from eleven t-tests. Tests 3 and 4 provided the evidence for DeSante's claim that, "compared to African Americans, whites are not automatically perceived as more deserving of government assistance."

Here's what DeSante did in test 3: DeSante took the $556 allocated to Laurie in condition 7 when Laurie was paired with Keisha and compared that to the $546 allocated to Latoya in condition 10 when Latoya was paired with Keisha; that $9 advantage (bear with the rounding error) for Laurie over Latoya (when both applicants were paired with Keisha and neither had a Worker Quality Assessment) did not reach conventional levels of statistical significance.
Here's what DeSante did in test 4: DeSante took the $587 allocated to Emily in condition 4 when Emily was paired with Laurie and compared that to the $600 allocated to Keisha in condition 7 when Keisha was paired with Laurie; that $12 advantage for Keisha over Emily (when both applicants were paired with Laurie and neither had a Worker Quality Assessment) did not reach conventional levels of statistical significance.
So which of these three tests is the best test? My test had more observations, compared within instead of across conditions, and had a lower standard error. But DeSante's tests are not wrong or meaningless: the problem is that tests 3 and 4 provide incomplete information for the purposes of testing for racial bias against applicants with no reported Worker Quality Assessment.
---
Here's the next part of that quote from DeSante (2013: 343):
Instead, the way hard work and "laziness" are treated is conditioned by race: whites gain more for the same level of effort, and blacks are punished more severely for the same level of "laziness."
Here's what DeSante did to produce this inference. Emily received a mean allocation of $587 in condition 4 when paired with Laurie and neither applicant had a Worker Quality Assessment; but hard-working Emily received $711 in condition 6 when paired with lazy Laurie. This $123 difference can be interpreted as a reward for Emily's hard work, at least in relation to Laurie's laziness.
Now we do the same thing for Keisha paired with Laurie: Keisha received a mean allocation of $600 in condition 7 when paired with Laurie and neither applicant had a Worker Quality Assessment; but hard-working Keisha received $607 in condition 9 when paired with lazy Laurie. This $7 difference can be interpreted as a reward for Keisha's hard work, at least in relation to Laurie's laziness.
Test 7 indicates that the $123 reward to Emily for her hard work was larger than the $7 reward to Keisha for her hard work (p=0.03).
But notice that DeSante could have conducted another set of comparisons:
Laurie received a mean allocation of $556 in condition 7 when paired with Keisha and neither applicant had a Worker Quality Assessment; but hard-working Laurie received $620 in condition 8 when paired with lazy Keisha. This $64 difference can be interpreted as a reward for Laurie's hard work, at least in relation to Keisha's laziness.
Now we do the same thing for Latoya paired with Keisha: Latoya received a mean allocation of $546 in condition 10 when paired with Keisha and neither applicant had a Worker Quality Assessment; but hard-working Latoya received $627 in condition 11 when paired with lazy Keisha. This $81 difference can be interpreted as a reward for Latoya's hard work, at least in relation to Keisha's laziness.
The $16 difference between Laurie's $64 reward for hard work and Latoya's $81 reward for hard work (rounding error, again) is not statistically significant at conventional levels (p=0.76). The combined effect of the DeSante test and my alternate test is not statistically significant at conventional levels (effect of $49, p=0.20), so -- in this dataset -- there is a lack of evidence at a statistically significant level for the claim that "whites gain more for the same level of effort."
I conducted a similar set of alternate tests for the inference that "blacks are punished more severely for the same level of "laziness"; the effect size was smaller in my test compared to DeSante's test, but evidence for the the combined effect was believable: a $74 effect, with p=0.06.
---
Here's the next part of that quote from DeSante (2013: 343):
Second, and consistent with those who take the "principled ideology" approach to the new racism measures, the racial resentment scale is shown to predict a desire for smaller government and less government spending. However, in direct opposition to this ideology-based argument, this effect is conditional upon the race of the persons placing demands on the government: the effect of racial resentment on a desire for a smaller government greatly wanes when the beneficiaries of that government spending are white as opposed to black. This represents strong evidence that racial resentment is more racial animus than ideology.
DeSante based this inference on results reported in Table 3, reproduced below:

Notice the note at the bottom: "White respondents only." DeSante reported results in Table 3 based on responses only from respondents coded as white, but reported results in Table 2 based on responses from respondents coded as white, black, Asian, Native American, mixed race, or Other. Maybe there's a good theoretical reason for changing the sample. DeSante's data and code are posted here if you are interested in what happens to p-values when Table 2 results are restricted to whites and Table 3 results include all respondents.
But let's focus on the bold RRxWW line in Table 3. RR is racial resentment, and WW is a dichotomous variable for the conditions in which both applicants were white. Model 3 includes categories for WW (two white applicants paired together), BB (two black applicants paired together), and WB (one white applicant paired with one black applicant); this is very important, because these included terms must be interpreted in relation to the omitted category that I will call NN (two unnamed applicants paired together). Therefore, the -337.92 coefficient on the RRxWW variable in model 3 indicates that -- all other model variables held constant -- white respondents allocated $337.92 less to offset the state budget deficit when both applicants were white compared to when both applicants were unnamed.
The -196.43 coefficient for the RRxBB variable in model 3 indicates that -- all other model variables held constant -- white respondents allocated $196.43 less to offset the state budget deficit when both applicants were black compared to when both applicants were unnamed. This -$196.43 coefficient did not reach statistical significance, but the coefficient is important because the bias in favor of the two white applicants relative to the two black applicants is only -$337.92 minus -$196.43; so whites allocated $141.49 less to offset the state budget deficit when both applicants were white compared to when both applicants were black, but the p-value for this difference was 0.41.
---
Here's a few takeaways from the above analysis:
1. The limited choice of statistical tests reported in DeSante (2013) produced inferences that overestimated the extent of bias against black applicants and missed evidence of bias against white applicants.
2. Takeaway 1 depends on the names reflecting only race of the applicant. But the names might have reflected something other than race; for instance, in condition 10, Keisha received a mean allocation $21 higher than the mean allocation to Latoya (p=0.03): such a difference is not expected if Keisha and Latoya were "all else equal."
3. Takeaway 1 would likely not have been uncovered had the AJPS not required the posting of data and replication files from its published articles.
4. Pre-registration would eliminate suspicion about research design decisions, such as decisions to restrict only some analyses to whites and to report some comparisons but not others.
---
In case you are interested in reproducing the results that I discussed, the data are here, code is here, and the working paper is here. Comments are welcome.
---
UPDATE (Nov 2, 2014)
I recently received a rejection for the manuscript describing the results reported above; the second reviewer suggested portraying the raw data table as a graph: I couldn't figure out an efficient way to do that, but the suggestion did get me to realize a good way to present the main point of the manuscript more clearly with visuals.
The figure below illustrates the pattern of comparison for DeSante 2013 tests 1 and 2: solid lines represent comparisons reported in DeSante 2013 and dashed lines represent unreported equivalent or relevant comparisons; numbers in square brackets respectively indicate the applicant and the condition, so that [1/2] indicates applicant 1 in condition 2.

---
The figure below indicates the pattern of reported and unreported comparisons for black applicants and white applicants with no Worker Quality Assessment: the article reported two small non-statistically significant differences when comparing applicants across conditions, but the article did not report the larger statistically significant difference favoring the black applicant when a black applicant and a white applicant were compared within conditions.
 ---
---
The figure below indicates the pattern of reported and unreported comparisons for the main takeaway of the article. The left side of the figure indicates that one of the black applicants received a lesser reward for an excellent Worker Quality Assessment and received a larger penalty for a poor Worker Quality Assessment, compared to the reward and penalty for the corresponding white applicant; however, neither the lesser reward for an excellent Worker Quality Assessment nor the larger penalty for a poor Worker Quality Assessment was present at a statistically significant level in the comparisons on the right, which were not reported in the article (p=0.76 and 0.31, respectively).
 ---
---
Data for the reproduction are here. Reproduction code is here.
---
UPDATE (Mar 8, 2015)
The above analysis has been published here by Research & Politics.
Rattan et al. (2012) reported evidence, as indicated in the abstract, that:
...simply bringing to mind a Black (vs. White) juvenile offender led participants to view juveniles in general as significantly more similar to adults in their inherent culpability and to express more support for severe sentencing.
Data for the study were collected by the Time Sharing Experiments for the Social Sciences and are located here.*
In this post, I present results of an attempt to reproduce and extend this study.
---
The first takeaway is substantive: the reproduction and extension suggest that Rattan et al. might have applied the incorrect theory to explain results because their reported analyses were limited to white respondents.
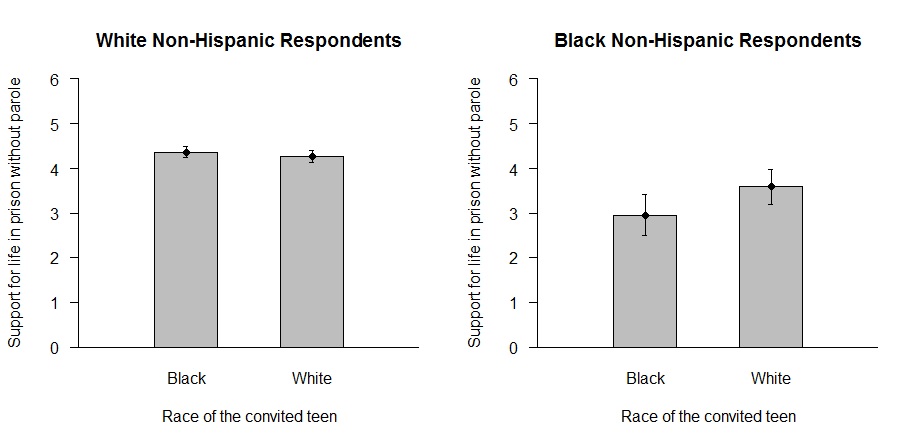
Here's part of a figure from Rattan et al. (2012):

The figure indicates that white respondents in the study expressed more support for life in prison without parole when primed to think about a black juvenile offender than when primed to think about a white juvenile offender. The authors appear to attribute this racial bias to stereotypic associations:
The results also extend the established literature in social psychology examining the cognitive association between the social category "Black" and criminality, and raise the possibility that this race-crime association may be at odds with lay people’s typical notions about the innocence of juveniles. [citation removed]
But here are the results when observations from both white and black respondents are reported:

Blacks offered more support for life in prison without parole when primed to think of a white juvenile offender than when primed to think of a black juvenile offender. If there is a generalized effect here, it does not appear that the effect is caused by stereotypic associations of criminality with the social category "black." It seems more likely that the racial bias detected in the study reflected ingroup favoritism or outgroup antagonism among both whites and blacks.
Check out the working paper here for more detail on the results, a more nuanced breakdown of white responses, background on related research, and policy implications; feel free to comment on this blog post or to email comments regarding the working paper.
---
The second takeaway is methodological: the reproduction and extension suggest that this study seems to suffer from researcher degrees of freedom.
One of the first things that I noticed when comparing the article to the data was that the article mentioned two dependent variables but there appeared to be four dependent variables in the survey; based on my analyses, the two dependent variables not mentioned in the study did not appear to provide evidence of racial bias. I suppose that I can understand the idea that these null findings reflect "failed" experiments in some way, but I'd have liked as a reader to have been informed that racial bias was detected for only half of the dependent variables.
I also noticed that the dataset had three manipulation check items, but only one of these manipulation checks was used in the analysis; of course, the manipulation check that was used was the most important manipulation check (remembering the race of the juvenile offender), but I'd have liked as a reader to have been informed that manipulation checks for the juvenile offender's age and crime were unused.
And I noticed -- and this is more a problem with SPSS and statistics training than with the Rattan et al. analysis -- that the weighting of observations in SPSS resulted in incorrectly deflated p-values. I discussed this problem here and here and here; data for the first link were the Rattan et al. (2012) data.
---
* There are two datasets for the Rattan et al. (2012) study. I received the full dataset in an email from TESS, and this dataset was previously posted at the TESS archive; the dataset currently posted at the TESS archive contains a weight2 variable for only white respondents who met participation criteria, provided complete data, and finished the survey in one minute or longer.
---
UPDATE (Mar 15, 2015)
Replaced the figure with results for white and black respondents, which should have ranged from 1 to 6. The original figure incorrectly ranged from 0 to 6.
I have posted a working manuscript on symbolic racism here, with its appendix here. Comments are welcome and appreciated. I'll outline the manuscript below and give some background to the research.
---
On 27 October 2012, a Facebook friend posted a link to an Associated Press report "AP poll: Majority harbor prejudice against blacks." I posted this comment about the report:

During the Facebook discussion, I noted that it not obvious that the implicit measurements indicate racism, given the data on implicit preferences among blacks:

Bob Somersby at the Daily Howler noticed that the AP report provided data disaggregated by political party but failed to provide data disaggregated by race:
Although Ross and Agiesta were eager to tell you how many Democrats, Republicans and independents were shown to hold "anti-black feelings," they never tell you how many black respondents “hold anti-black feelings” as well!
Why didn't our intrepid reporters give us that information? We can't answer that question. But even a mildly skeptical observer could imagine one possible answer:
If substantial percentages of black respondents were allegedly shown to "hold anti-black feelings," that would make almost anyone wonder how valid the AP's measures may be. It would undermine confidence in the professors—in those men of vast erudition, the orange-shoed fellows who still seem to think that Obama trailed in the national polling all through the summer of 2008.
David Moore at iMediaEthics posted data disaggregated by race that he retrieved from the lead author of the study: based on the same method used in the original report, 30 percent of white Americans implicitly held anti-white sentiments, and 43 percent of black Americans implicitly held anti-black sentiments. Moore discussed how this previously-unreported information alters interpretation of the study's findings:
It appears that racism, as measured by this process, is much more complicated than the news story would suggest. We cannot talk about the 56% of Americans with "anti-black" attitudes as being "racist," if we do not also admit that close to half of all blacks are also "racist" – against their own race.
If we accept the measures of anti-black attitudes as a valid indicator of racism, then we also have to accept the anti-white measures as racism.
Moore did not tell us the results for black respondents on the explicit measures of racism, so that's the impetus behind Study 2 of the working manuscript.
---
The explicit racism measure discussed in the AP report is symbolic racism, also known as racial resentment. Instead of explaining what symbolic racism is, I'll show how symbolic racism is typically measured; items below are from the American National Election Studies, but there were more items in the study discussed in the AP report.
Symbolic racism is measured in the ANES based on whether a survey respondent agrees strongly, agrees somewhat, neither agrees nor disagrees, disagrees somewhat, or disagrees strongly with these four items:
1. Irish, Italians, Jewish and many other minorities overcame prejudice and worked their way up. Blacks should do the same without any special favors.
2. Generations of slavery and discrimination have created conditions that make it difficult for blacks to work their way out of the lower class.
3. Over the past few years, blacks have gotten less than they deserve.
4. It's really a matter of some people not trying hard enough; if blacks would only try harder they could be just as well off as whites.
I hope that you can see why these are not really measures of explicit racism. Let's say that non-racist person A opposes special favors for all groups: that person would select the symbolic racist option for item 1, indicating a belief that blacks should work their way up without special favors. Person A is coded the same as a person B who opposes special favors for blacks because of person B's racism. So that's problem #1 with symbolic racism measures: the measures conflate racial attitudes and non-racial beliefs.
But notice that there is another problem. Let's say that person C underestimates the influence of slavery and discrimination on outcomes for contemporary blacks; person C will select a symbolic racism option for item 2, but is that racism? is that racial animosity? is that a reflection that a non-black person -- and even some black persons -- might not appreciate the legacy of slavery and discrimination? or is that something else? That's problem #2 with symbolic racism measures: it's not obvious how to interpret these measures.
---
Researchers typically address problem 1 with control variables; the hope is that placing partisanship, self-reported ideology, and a few conservative values items into a regression sufficiently dilutes the non-racial component of symbolic racism so that the effect of symbolic racism can be interpreted as its racial component only.
In the first part of the working manuscript, I test this hope by predicting non-racial dependent variables, such as opposition to gay marriage. The idea of this test is that -- if statistical control really does sufficiently dilute the non-racial component of symbolic racism -- then symbolic racism should not correlate with opposition to gay marriage, because racism should not be expected to correlate with opposition to gay marriage; but -- if there is a correlation between symbolic racism and gay marriage -- then statistical control did not sufficiently dilute the non-racial component of symbolic racism.
The results indicate that a small set of controls often does not sufficiently dilute the non-racial component of symbolic racism, so results from symbolic racism research with a small set of controls should be treated skeptically. But a more extensive set of controls often does sufficiently dilute the non-racial component of symbolic racism, so we can place more -- but not complete -- confidence in results from symbolic racism research with an extensive set of controls.
---
The way that I addressed problem #2 -- about how to interpret symbolic racism measures -- is to assess the effect of symbolic racism among black respondents. Results indicate that among blacks -- and even among a set of black respondents with quite positive views of their own racial group -- symbolic racism sometimes positively correlates with opposition to policies to help blacks.
Study 2 suggests that it is not legitimate for researchers to interpret symbolic racism among whites differently than symbolic racism among blacks, without some other information that can permit us to state that symbolic racism means something different for blacks and whites. Study 3 assesses whether there is evidence that symbolic racism means something different for blacks and whites.
I have been trying to reproduce several studies and have noticed that the reporting of results from these studies often presents a much stronger impression of results than I get from an investigation of the data itself. I plan to report some of these reproduction attempts, so I have been reading literature on researcher degrees of freedom and the file drawer problem. Below I'll post and comment on some interesting passages that I have happened upon.
---
To put it another way: without modern statistics, we find it unlikely that people would take seriously a claim about the general population of women, based on two survey questions asked to 100 volunteers on the internet and 24 college students. But with the p-value, a result can be declared significant and deemed worth publishing in a leading journal in psychology. (Gelman and Loken, 2013, 14-15, emphasis in the original)
I wonder how many people in the general population take seriously general claims based on only small mTurk and college student samples, provided that these people are informed that these general claims are based only on small unrepresentative samples; I suspect that some of the "taking seriously" that leads to publication in leading psychology journals reflects professional courtesy among peer researchers whose work is also largely based on small unrepresentative samples.
---
Maybe it's because I haven't done much work with small unrepresentative samples, but I feel cheated when investing time in an article framed in general language that has conclusions based on small unrepresentative samples. Here's an article that I recently happened upon: "White Americans' opposition to affirmative action: Group interest and the harm to beneficiaries objection." The abstract:
We focused on a powerful objection to affirmative action – that affirmative action harms its intended beneficiaries by undermining their self-esteem. We tested whether White Americans would raise the harm to beneficiaries objection particularly when it is in their group interest. When led to believe that affirmative action harmed Whites, participants endorsed the harm to beneficiaries objection more than when led to believe that affirmative action did not harm Whites. Endorsement of a merit-based objection to affirmative action did not differ as a function of the policy’s impact on Whites. White Americans used a concern for the intended beneficiaries of affirmative action in a way that seems to further the interest of their own group.
So who were these white Americans?
Sixty White American students (37% female, mean age = 19.6) at the University of Kansas participated in exchange for partial course credit. One participant did not complete the dependent measure, leaving 59 participants in the final sample. (p. 898)
I won't argue that this sort of research should not be done, but I'd like to see this sort of exploratory research replicated with a more representative sample. One of the four co-authors listed her institutional affiliation at California State University San Bernardino, and two other co-authors listed their institutional affiliation at Tulane University, so I would have liked to have seen a second study among a different sample of students. At the very least, I'd like to see a description of the restricted nature of the sample in the abstract to let me and other readers make a more informed judgment about the value of investing time in the article.
---
The Gelman and Loken (2013) passage cited above reminded me of a recent controversy regarding a replication attempt of Schnall et al. (2008). I read about the controversy in a Nicole Janz post at Political Science Replication. The result of the replication (a perceived failure to replicate) was not shocking because Schnall et al. (2008) had reported only two experiments based on data from 40 and 43 University of Plymouth undergraduates.
---
Schnall in a post on the replication attempt:
My graduate students are worried about publishing their work out of fear that data detectives might come after them and try to find something wrong in their work. Doing research now involves anticipating a potential ethics or even criminal investigation.
I like the term "data detectives" a bit better than "replication police" (h/t Nicole Janz), so I think that I might adopt the label "data detective" for myself.
I can sympathize with the graduate students' fear that someone might target my work and try to find an error in that work, but that's a necessary occupational hazard for a scientist.
The best way to protect research from data detectives is to produce reproducible and perceived replicable research; one of the worst ways to protect research from data detectives is to publish low-powered studies in a high-profile journal, because the high profile draws attention and the low power increases suspicions that the finding was due to the non-reporting of failed experiments.
---
From McBee and Matthews (2014):
Researchers who try to serve the interests of science are going to find themselves out-competed by those who elect to “play the game,” because the ethical researcher will conduct a number of studies that will prove unpublishable because they lack statistically significant findings, whereas the careerist will find ways to achieve significance far more frequently. (p. 77)
This reflects part of the benefit produced by data detectives and the replication police: a more even playing field for researchers reluctant to take advantage of researcher degrees of freedom.
---
This Francis (2012) article is an example of a data detective targeting an article to detect non-reporting of experiments. Balcetis and Dunning (2010) reported five experiments rejecting the null hypothesis; the experiments had Ns, effect sizes, and powers as listed below in a table drawn from Francis (2012) p. 176.
 Francis summed the powers to get 3.11, which indicates the number of times that we should expect the null hypothesis to be rejected given the observed effect sizes and powers of the 5 experiments; Francis multiplied the powers to get 0.076, which indicates the probability that the null hypothesis will be rejected in all 5 experiments.
---
Here is Francis again detecting more improbable results. And again. Here's a back-and-forth between Simonsohn and Francis on Francis' publication bias studies.
---
Here's the Galak and Meyvis (2012) reply to another study in which Francis claimed to have detected non-reporting of experiments in Galak and Meyvis (2011). Galak and Meyvis admit to the non-reporting:
We reported eight successful demonstrations of this phenomenon in our paper, but we also conducted five additional studies whose results either did not reach conventional levels of significance or did reach significance but ended up being rhetorically redundant. (p. 595)
...but argue that it's not a problem because they weren't interested in effect sizes:
However, as is the case for many papers in experimental psychology, the goal was never to assess the exact size of the effect, but rather to test between competing theoretical predictions. (p. 595)
Even if it is true that the authors were unconcerned with effect size, I do not understand how that justifies not reporting results that fail to reach conventional levels of statistical significance.
So what about readers who *are* interested in effect sizes? Galak and Meyvis write:
If a researcher is interested in estimating the size of an effect reported in a published paper, we recommend asking the authors for their file drawer and conducting a meta-analysis. (p. 595-596)
That's an interesting solution: if you are reading an article and wonder about the effect size, put down the article, email the researchers, hope that the researchers respond, hope that the researchers send the data, and then -- if you receive the data -- conduct your own meta-analysis.
I came across an interesting site, Dynamic Ecology, and saw a post on self-archiving of journal articles.The post mentioned SHERPA/RoMEO, which lists archiving policies for many journals. The only journal covered by SHERPA/RoMEO that I have published in that permits self-archiving is PS: Political Science & Politics, so I am linking below to pdfs of PS articles that I have published.
---
This first article attempts to help graduate students who need seminar paper ideas. The article grew out of a graduate seminar in US voting behavior with David C. Barker. I noticed that several articles on the seminar reading list placed in top-tier journals but made an incremental theoretical contribution and used publicly-available data, which was something that I as a graduate student felt that I could realistically aspire to.
For instance, John R. Petrocik in 1996 provided evidence that candidates and parties "owned" certain issues, such as Democrats owning care for the poor and Republicans owning national defense. Danny Hayes extended that idea by using publicly-available ANES data to provide evidence that candidates and parties owned certain traits, such as Democrats being more compassionate and Republicans being more moral.
The original manuscript identified the Hayes article as a travel-type article in which the traveling is done by analogy. The final version of the manuscript lost the Hayes citation but had 19 other ideas for seminar papers. Ideas on the cutting room floor included replication and picking a fight with another researcher.
Of Publishable Quality: Ideas for Political Science Seminar Papers. 2011. PS: Political Science & Politics 44(3): 629-633.
---
This next article grew out of reviews that I conducted for friends, colleagues, and journals. I noticed that I kept making the same or similar comments, so I produced a central repository for generalized forms of these comments in the hope that -- for example -- I do not review any more manuscripts that formally list hypotheses about the control variables.
Rookie Mistakes: Preemptive Comments on Graduate Student Empirical Research Manuscripts. 2013. PS: Political Science & Politics 46(1): 142-146.
---
The next article grew out of friend and colleague Jonathan Reilly's dissertation. Jonathan noticed that studies of support for democracy had treated don't know responses as if the respondents had never been asked the question. So even though 73 percent of respondents in China expressed support for democracy, that figure was reported as 96 percent because don't know responses were removed from the analysis.
The manuscript initially did not include imputation of preferences for non-substantive responders, but a referee encouraged us to estimate missing preferences. My prior was that multiple imputation was "making stuff up," but research into missing data methods taught me that the alternative -- deletion of cases -- assumed that cases were missing at random, which did not appear to be true in our study: the percent of missing cases in a country correlated at -0.30 and -0.43 with the country's Polity IV democratic rating, which meant that respondents were more likely to issue a non-substantive response in countries where political and social liberties are more restricted.
Don’t Know Much about Democracy: Reporting Survey Data with Non-Substantive Responses. 2012. PS: Political Science & Politics 45(3): 462-467. Second author, with Jonathan Reilly.
The American National Elections Studies (ANES) has measured abortion attitudes since 1980 with an item that dramatically inflates the percentage of pro-choice absolutists:
There has been some discussion about abortion during
recent years. Which one of the opinions on this page best agrees with your view? You can just tell me the number of the opinion you choose.
1. By law, abortion should never be permitted.
2. The law should permit abortion only in case of rape, incest, or when the woman's life is in danger.
3. The law should permit abortion for reasons other than rape, incest, or danger to the woman's life, but only after the need for the abortion has been clearly established.
4. By law, a woman should always be able to obtain an abortion as a matter of personal choice.
5. Other {SPECIFY}
In a book chapter of Improving Public Opinion Surveys: Interdisciplinary Innovation and the American National Election Studies, Heather Marie Rice and I discussed this measure and results from a new abortion attitudes measure piloted in 2006 and included on the 2008 ANES Time Series Study. The 2006 and 2008 studies did not ask any respondents both abortion attitudes measures, but the 2012 study did. This post presents data from the 2012 study describing how persons selecting an absolute abortion policy option responded when asked about policies for specific abortion conditions.
---
Based on the five-part item above, and removing from the analysis the five persons who provided an Other response, 44 percent of the population agreed that "[b]y law, a woman should always be able to obtain an abortion as a matter of personal choice." The figure below indicates how these pro-choice absolutists later responded to items about specific abortion conditions.
Red bars indicate the percentage of persons who agreed on the 2012 pre-election survey that "[b]y law, a woman should always be able to obtain an abortion as a matter of personal choice" but reported opposition to abortion for the corresponding condition in the 2012 post-election survey.

Sixty-six percent of these pro-choice absolutists on the 2012 pre-election survey later reported opposition to abortion if the reason for the abortion is that the child will not be the sex that the pregnant woman wanted. Eighteen percent of these pro-choice absolutists later reported neither favoring nor opposing abortion for that reason, and 16 percent later reported favoring abortion for that reason. Remember that this 16 percent favoring abortion for reasons of fetal sex selection is 16 percent of the pro-choice absolutist subsample.
In the overall US population, only 8 percent favor abortion for fetal sex selection; this 8 percent is a more accurate estimate of the percent of pro-choice absolutists in the population than the 44 percent estimate from the five-part item.
---
Based on the five-part item above, and removing from the analysis the five persons who provided an Other response, 12 percent of the population thinks that "[b]y law, abortion should never be permitted." The figure below indicates how these pro-life absolutists later responded to items about specific abortion conditions.
Green bars indicate the percentage of persons who agreed on the 2012 pre-election survey that "[b]y law, abortion should never be permitted" but reported support for abortion for the corresponding condition in the 2012 post-election survey.

Twenty-nine percent of these pro-life absolutists on the 2012 pre-election survey later reported support for abortion if the reason for the abortion is that the woman might die from the pregnancy. Twenty-nine percent of these pro-choice absolutists later reported neither favoring nor opposing abortion for that reason, and 42 percent later reported opposing abortion for that reason. Remember that this 42 percent opposing abortion for reasons of protecting the pregnant woman's life is 42 percent of the pro-life absolutist subsample.
In the overall US population, only 11 percent oppose abortion if the woman might die from the pregnancy; this 11 percent is a more accurate estimate of the percent of pro-life absolutists in the US population than the 12 percent estimate from the five-part item.
---
There is a negligible difference in measured pro-life absolutism between the two methods, but the five-part item inflated pro-choice absolutism by a factor of 5. Our book chapter suggested that this inflated pro-choice absolutism might result because the typical person considers abortion in terms of the hard cases, especially since the five-part item mentions only the hard cases of rape, incest, and danger to the pregnant woman's life.
---
Notes
1. The percent of absolutists is slightly smaller if absolutism is measured as supporting or opposing abortion in each listed condition.
2. The percent of pro-life absolutists is likely overestimated in the "fatal" abortion condition item because the item asks about abortion if "staying pregnant could cause the woman to die"; presumably, there would be less opposition to abortion if the item stated with certainty that staying pregnant would cause the woman to die.
3. Data presented above are for persons who answered the five-part abortion item on the 2012 ANES pre-election survey and answered at least one abortion condition item on the 2012 ANES post-election survey. Don't know and refusal responses were listwise deleted for each cross-tabulation. Data were weighted with the Stata command svyset [pweight=weight_full], strata(strata_full); weighted cross-tabulations were calculated with the command svy: tabulate X Y if Y==Z, where X is the abortion condition item, Y is the five-part abortion item, and Z is one of the absolute policy options on the five-part item.
4. Here is the text for each abortion condition item that appeared on the 2012 ANES Time Series post-election survey:
>[First,/Next,] do you favor, oppose, or neither favor nor oppose abortion being legal if:
* staying pregnant could cause the woman to die
* the pregnancy was caused by the woman being raped
* the fetus will be born with a serious birth defect
* the pregnancy was caused by the woman having sex with a blood relative
* staying pregnant would hurt the woman's health but is very unlikely to cause her to die
* having the child would be extremely difficult for the woman financially
* the child will not be the sex the woman wants it to be
There was also a general item on the post-election survey:
Next, do you favor, oppose, or neither favor nor oppose abortion being legal if the woman chooses to have one?
5. Follow-up items to the post-election survey abortion items asked respondents to indicate intensity of preference, such as favor a great deal, favor moderately, or favor a little. These follow-up items were not included in the above analysis.
6. There were more than 5000 respondents for the pre-election and post-election surveys.