Reproducing a study of racial bias against juvenile offenders
Rattan et al. (2012) reported evidence, as indicated in the abstract, that:
...simply bringing to mind a Black (vs. White) juvenile offender led participants to view juveniles in general as significantly more similar to adults in their inherent culpability and to express more support for severe sentencing.
Data for the study were collected by the Time Sharing Experiments for the Social Sciences and are located here.*
In this post, I present results of an attempt to reproduce and extend this study.
---
The first takeaway is substantive: the reproduction and extension suggest that Rattan et al. might have applied the incorrect theory to explain results because their reported analyses were limited to white respondents.
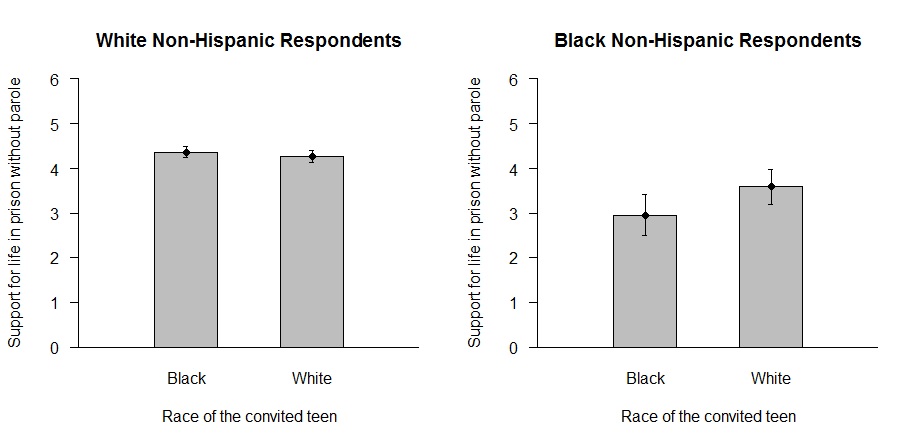
Here's part of a figure from Rattan et al. (2012):

The figure indicates that white respondents in the study expressed more support for life in prison without parole when primed to think about a black juvenile offender than when primed to think about a white juvenile offender. The authors appear to attribute this racial bias to stereotypic associations:
The results also extend the established literature in social psychology examining the cognitive association between the social category "Black" and criminality, and raise the possibility that this race-crime association may be at odds with lay people’s typical notions about the innocence of juveniles. [citation removed]
But here are the results when observations from both white and black respondents are reported:

Blacks offered more support for life in prison without parole when primed to think of a white juvenile offender than when primed to think of a black juvenile offender. If there is a generalized effect here, it does not appear that the effect is caused by stereotypic associations of criminality with the social category "black." It seems more likely that the racial bias detected in the study reflected ingroup favoritism or outgroup antagonism among both whites and blacks.
Check out the working paper here for more detail on the results, a more nuanced breakdown of white responses, background on related research, and policy implications; feel free to comment on this blog post or to email comments regarding the working paper.
---
The second takeaway is methodological: the reproduction and extension suggest that this study seems to suffer from researcher degrees of freedom.
One of the first things that I noticed when comparing the article to the data was that the article mentioned two dependent variables but there appeared to be four dependent variables in the survey; based on my analyses, the two dependent variables not mentioned in the study did not appear to provide evidence of racial bias. I suppose that I can understand the idea that these null findings reflect "failed" experiments in some way, but I'd have liked as a reader to have been informed that racial bias was detected for only half of the dependent variables.
I also noticed that the dataset had three manipulation check items, but only one of these manipulation checks was used in the analysis; of course, the manipulation check that was used was the most important manipulation check (remembering the race of the juvenile offender), but I'd have liked as a reader to have been informed that manipulation checks for the juvenile offender's age and crime were unused.
And I noticed -- and this is more a problem with SPSS and statistics training than with the Rattan et al. analysis -- that the weighting of observations in SPSS resulted in incorrectly deflated p-values. I discussed this problem here and here and here; data for the first link were the Rattan et al. (2012) data.
---
* There are two datasets for the Rattan et al. (2012) study. I received the full dataset in an email from TESS, and this dataset was previously posted at the TESS archive; the dataset currently posted at the TESS archive contains a weight2 variable for only white respondents who met participation criteria, provided complete data, and finished the survey in one minute or longer.
---
UPDATE (Mar 15, 2015)
Replaced the figure with results for white and black respondents, which should have ranged from 1 to 6. The original figure incorrectly ranged from 0 to 6.
Leave a Reply